Yearly Issuance and Underwriting of Debt and Equity in the United States (1996-2012)
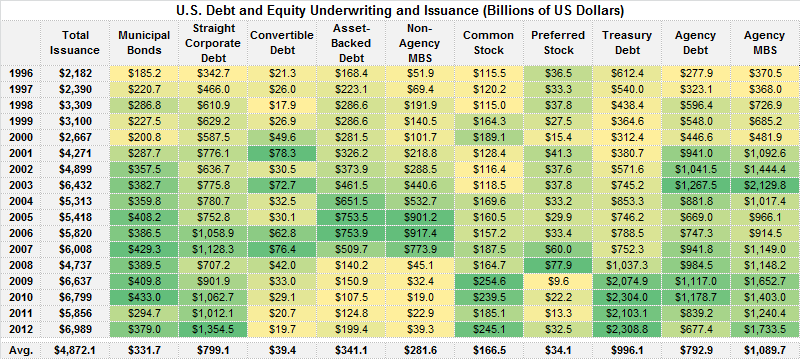
Last year a record of nearly $7 trillion in publicly traded securities were issued in the United States according to data from the Securities Industry and Financial Markets Association (SIFMA). Just under 4% was common and preferred stock, with the balance a variety of debt instruments.
- U.S. Treasury Debt $2.3 trillion
- U.S. Agency and Agency Mortgage Back Security (MBS) Debt $2.4 trillion
- Straight Corporate Debt $1.4 trillion
- Municipal Debt $379 billion
- Other Debt: Convertible $20 billion, Asset-Backed $199 billion and Non-Agency MBS $39 billion
- Common Stock $245 billion and Preferred Stock $33 billion
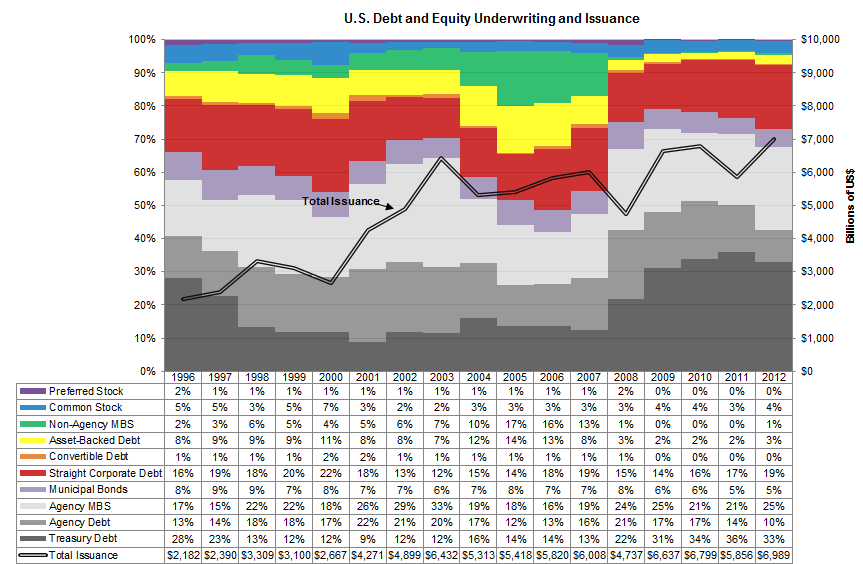
Over the past 17 years the amount of securities issued has risen from $2.1 trillion in 1996 to almost $7 trillion. Over that time the composition of securities issued and underwritten has changed.
- In 2012 approximately 36% of the total was U.S. Treasury Debt. Over the past 17 years the average percentage is close to 20%.
- From 2004 to 2007 between 10% and 17% of all issuance was non-agency (i.e. private) mortgage backed securities. The amount of non-agency MBS issued in 2012 was but a small fraction of the amount issued during the housing boom during the middle of the last decade.
- Asset-backed security issuance from 2004 to 2007 was unlike any year prior to or after this time period. Issuance peaked in 2006 at $753.9 billion (16% of all debt and equity issuance), which is more than the last five years combined; $722.8 billion from 2008-2012.
- Preferred stock issuance was particularly strong during 2008, the first year of the recession and financial crisis.
- Municipal bond issuance was lighter in 2011 than previous years, but picked up in 2012.
- Common stock underwriting bounced back in 2012 from 2011, but remains a small portion of the total universe and has, over the 1996-2012 time period, never been higher than the 7% level reached in 2000.
Data Source: Securities Industry and Financial Markets Association