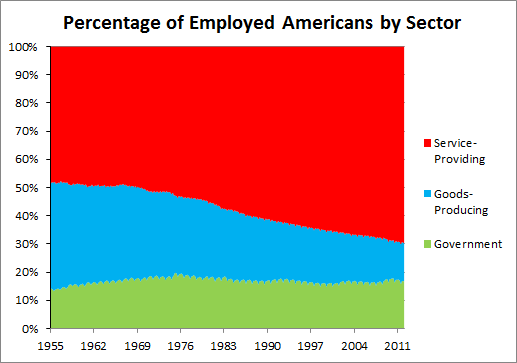
Over the past 56 years, the American employment landscape has undergone significant changes. The percentage of working Americans (excluding farmers) employed by the goods-producing industry has shrunk every year since 1955, while, over the same period, certain segments within the service-providing sector have continued to employ a greater percentage of Americans.
In 1955 around 38% of all working (non-farming) Americans were employed by the goods-producing sector, today that figure stands at only 13.5%. This has come about as the United States economy has gradually shifted away from being primarily a good-producing nation to one that provides services.
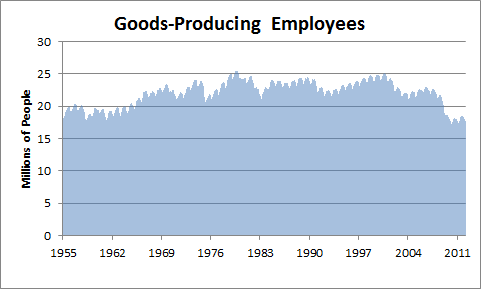
The number of Americans working in the goods-producing sector has been between 17 and 25 million since 1955. Today there are only as many Americans working in the goods producing sector as there were in 1958, just under 18 million individuals. In 1955 about 38% of employed Americans were categorized as goods-producing, today the figure sits at 13.5%.
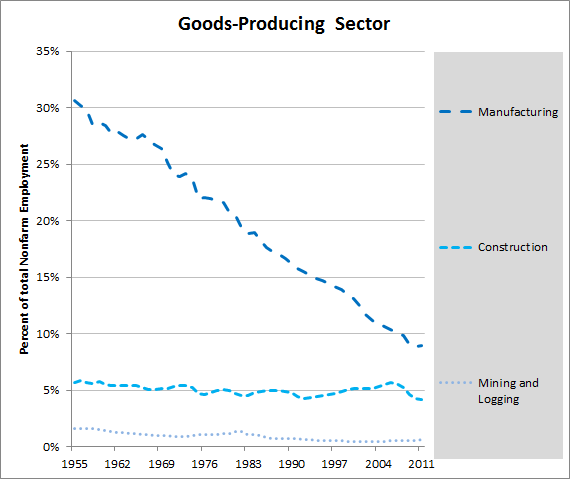
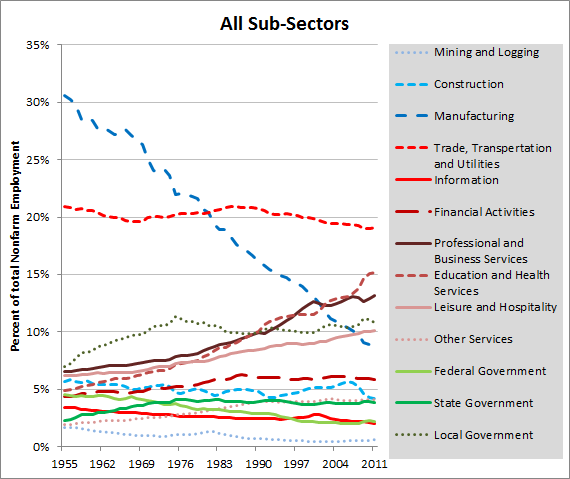
The main source of the decline in the percentage of Americans working in the good-producing sector has been due to the sharp drop off manufacturing employment. In 1955 nearly 31% of all working Americans were part of the in the manufacturing industry. At the end of 2011 only 8.9% of working adults were employed by manufacturers.
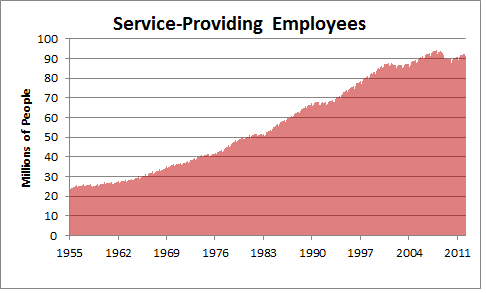
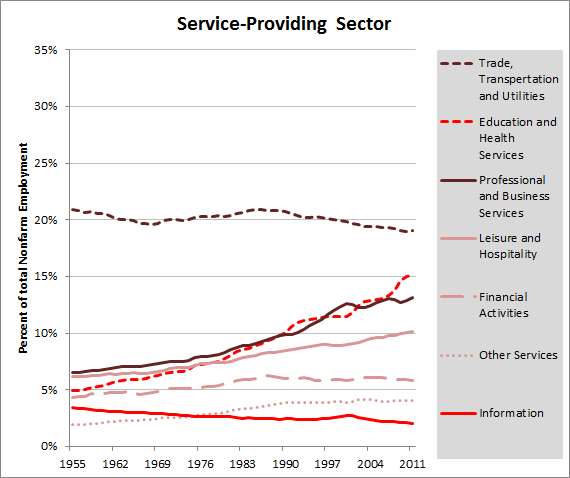
The number of employed Americans in the service-providing sector has gradually increased since 1955. The little dips that are evident in the first chart below correspond with economic recessions. The drops that stand out include the recessions of 1973-1975, 1980-1982, 1990-1991, 2001 and 2007-2009.
Sub-sectors within the service-providing sector that have gained the most over the past 56 years include 1) education and health services, 2) professional and business services and 3) leisure and hospitality. The percentage of employed Americans in each of the other service sub-sectors has remained fairly constant since 1955.
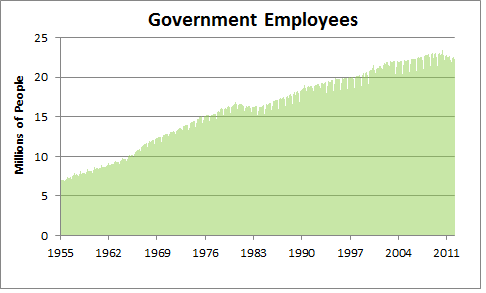
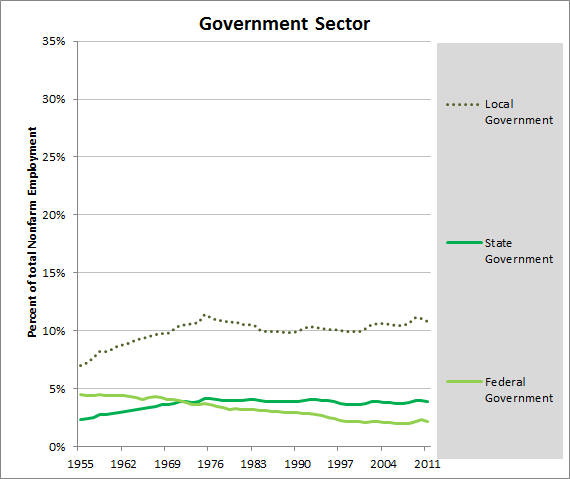
The number of individuals employed by the government has steadily increased since 1955, however the growth rate from 1968 to 2011 was no greater than that of the overall increase in the rate of American’s working (as illustrated in the second government chart). In the late 1950s and 1960s, however, the percentage of Americans working for state and local governments did increase. The percentage of working Americans employed by the federal government has declined since 1955.
Plotting all of the sub-sectors on one chart highlights the drop off in the share of manufacturing employment and the gradual increase in share of the service sub-sectors of education and health services, professional and business services and leisure and hospitality.
