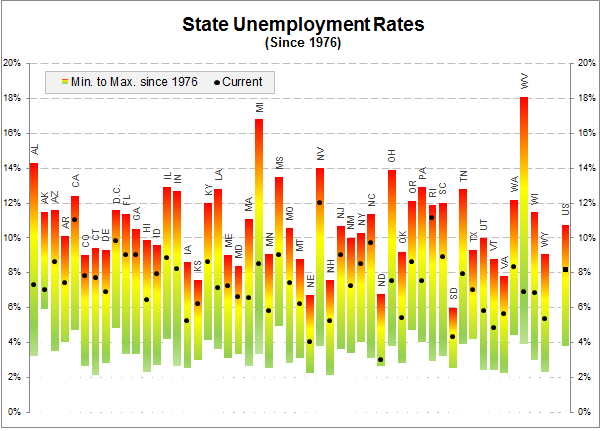
During March 2012 the national unemployment rate in the U.S. fell to 8.2%. Since topping out at 10.0% during October 2009 the rate has continued to follow a generally downward sloping path.
The national unemployment rate, while helpful in assessing the economic conditions of the U.S. as a whole, does not account for the differing economic environments around the country. By focusing on the unemployment rate in each of the 50 states plus the District of Columbia it is easier to appreciate the job prospects for people in different parts of the nation.
In the chart below, current state unemployment rates are plotted against the spectrum of unemployment rates each individual state has experienced since 1976. This allows for perspective on today’s unemployment rate. For example, the current unemployment rate in Alabama is 7.3%, while the peak, since 1976, was 14.3% and the bottom was 3.2%.
Highlights:
- During 2009 and 2010, ten states experienced their highest unemployment rate since 1976. These peaks were California 12.4%, Colorado 9.0%, Connecticut 9.4%, Florida 11.4%, Georgia 10.5%, Kansas 7.6%, Nevada 14%, North Carolina 11.4%, Rhode Island 11.9% and South Carolina 12%.
- North Dakota’s current unemployment rate of 3.0% is not only the lowest in the country but also close to the states record low rate of 2.6% enjoyed during July 2001.
- Only four states currently have an jobless rate of less than 5%; North Dakota, Nebraska, South Dakota and Vermont. (Alaska is the only state, since 1976, that has never had less than a 5% unemployment rate. The lowest for the state since 1976 was 5.9% in April of 2007).
- The unemployment rates in California, Colorado, Georgia, Nevada and Rhode Island all remain elevated and near record highs.
- As grisly as the Great Recession was, peak unemployment of 10.0% was not the highest that the national unemployment rate has been in recent history (1976 to present). The figure stood at 10.8% in November 1982. On the opposite end of the spectrum, the lowest national rate achieved since 1976 was 3.8% in April 2000, the height of the tech bubble.
