The U.S. Federal Reserve has statutory objectives, established by Congress in the Federal Reserve Act, to maximize employment and foster stable prices via monetary policy.
Since early 2009, the Federal Reserve has kept the discount rate (the rate at which the Federal Reserve offers funds to eligible commercial banks or other depository institutions) at 0.125% and engaged in multiple bond buying programs in order to try to fulfill its duties. The latest purchasing program has the Federal Reserve purchasing $85 billion of U.S. Treasury and mortgage-backed debt every month. This program does not have a set expiration.
Given these two objectives, what has unemployment and consumer inflation been like over the last 65 years?
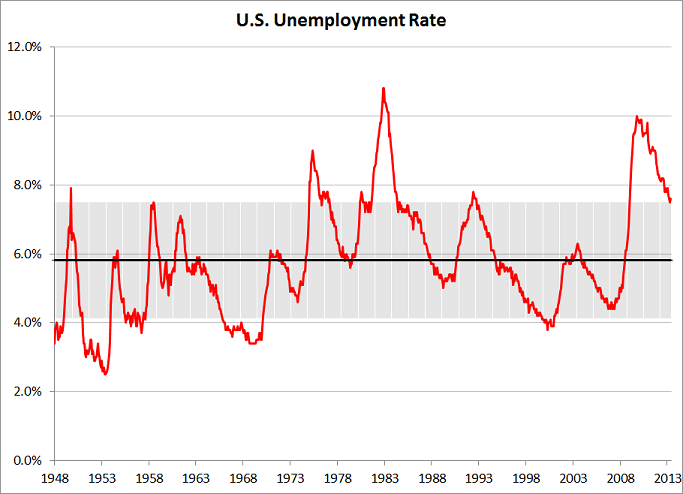
During the month of May unemployment stood at 7.6%. Though this figure is far below the 10.0% reached in October 2009, but is still distant from the 65 year average of 5.8% and remains just outside a range of 4.1% to 7.5% that has been common for the past six and a half decades.
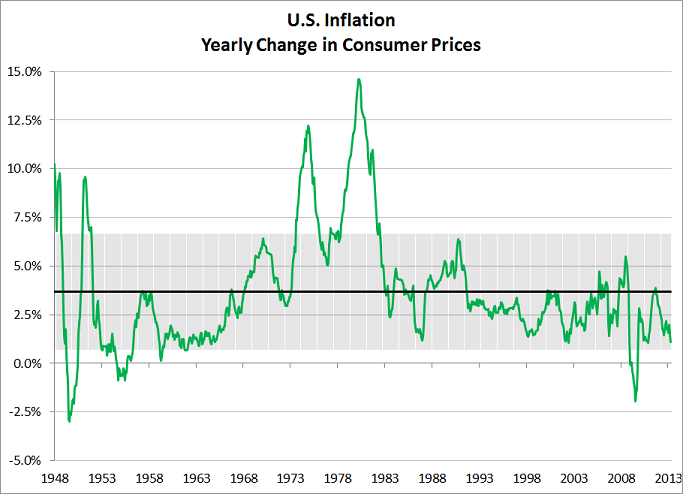
During the month of April, consumer prices were 1.1% higher than they were the previous April. This is far below the average 3.7% that consumer prices have increased on a yearly basis. It is even close to the bottom of the 0.7% to 6.7% range that yearly inflation has generally stayed within over the last 65 years.
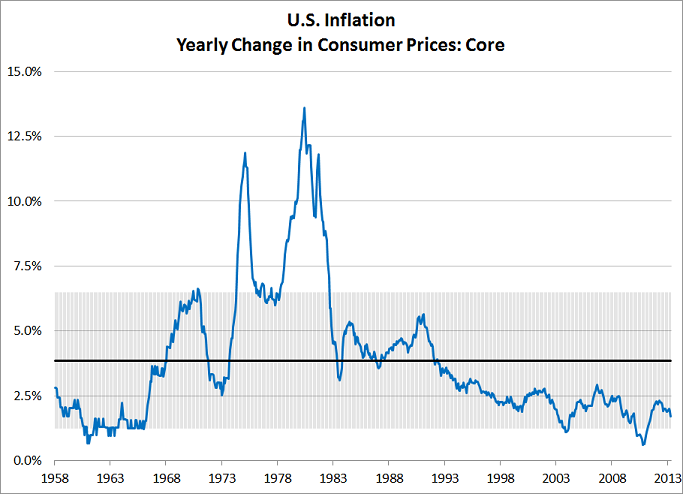
Excluding volatile food and energy prices, year over year consumer inflation for the month of April 2013 was 1.7%. This is well below the 55 year average of 3.9% and range of 1.2% to 6.5%.
Today, unemployment at 7.6% remains higher than the long term average and well above the 6.5% the Federal Reserve would like to see. Consumer inflation remains muted, below both the long term average and the 2.0% mark that the U.S. Federal Reserve aims for.