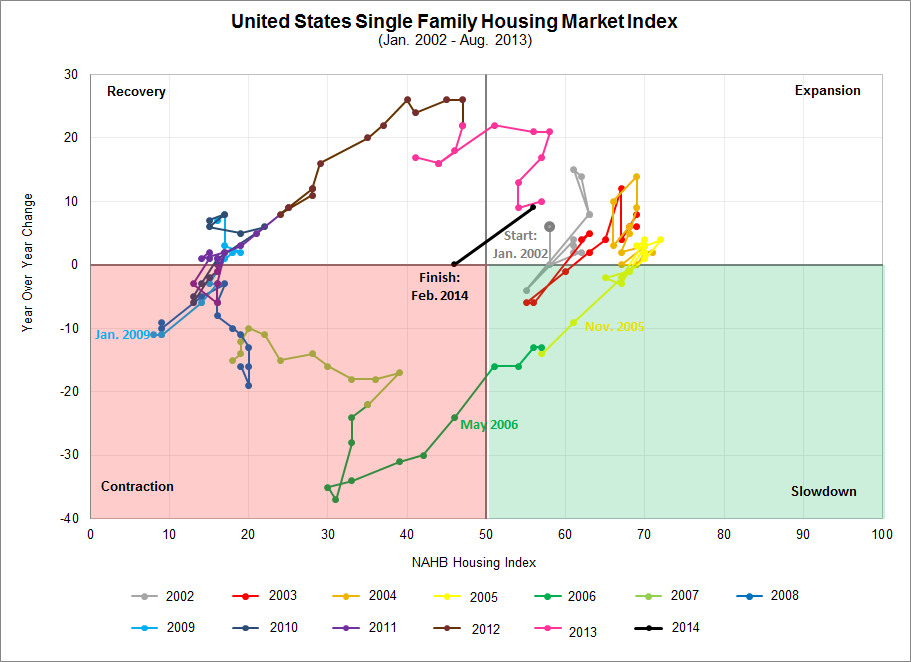
For the first time in nine months the United States Single Family Housing Market Index fell out of expansion territory.
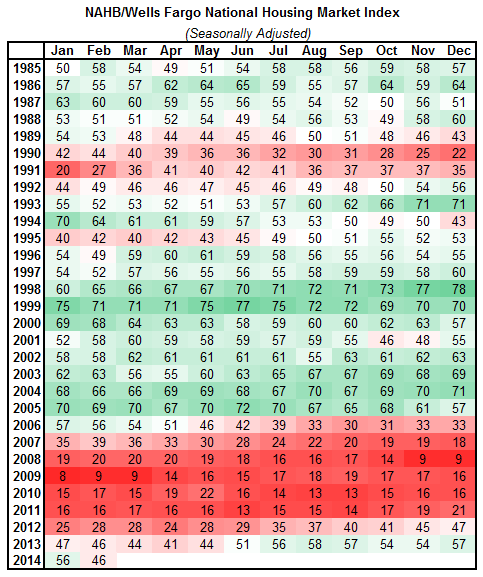
Each month the National Association of Home Builders (NAHB) surveys single family home builders across the U.S. From the responses that builders’ give regarding current sales, six month projections and buyers’ traffic, a single score is calculated and released by the NAHB. This month the score was 46, the lowest since a 44 was reported last May. The number can range between 0 and 100. Over 50 indicates that more builders view sales conditions as favorable compared with those who view them as unfavorable.
The chart below uses the single number from the NAHB and plots it against the year over year change in the figure. As stated, this February was a 46. Last February was also a 46, so the year over year change is zero.
The long path back from the housing collapse years of 2007-2009 started with a three year plus recovery period and was followed by an eight month expansion. With the expansion coming to an end this month, at least temporarily, it will be worth taking note of the March and April readings.