Since May of this year there has been a lot of speculation as to when the Federal Reserve will start to wind down the stimulative $85 billion per month bond buying program. Each month, as economic data is released, economists, analysts and pundits offer up their opinion regarding the timing and size of a possible future reduction in the program.
This week three important pieces of economic data were released that will help guide the decisions by the Fed; U.S. gross domestic product (used to measure the change in the size of the U.S. economy), non-farm payrolls (used to compute a national unemployment rate) and personal consumption expenditures (a measure used to calculate inflation experienced by consumers).
- The Q3 2013 annualized GDP growth figure was revised up from 2.8% to 3.6%. This was the fifth largest quarterly expansion in the U.S. economy since 2007.
- During the month of November non-farm payrolls increased by 203,000, the second largest monthly increase of the year. This was enough for the unemployment rate to drop from 7.3% in October to 7.0% in last month.
- From October 2012 to October 2013 the personal consumption expenditure index increased by 0.737%. This is the lowest year over year reading since late 2009 and among the lowest over the past 53 years.
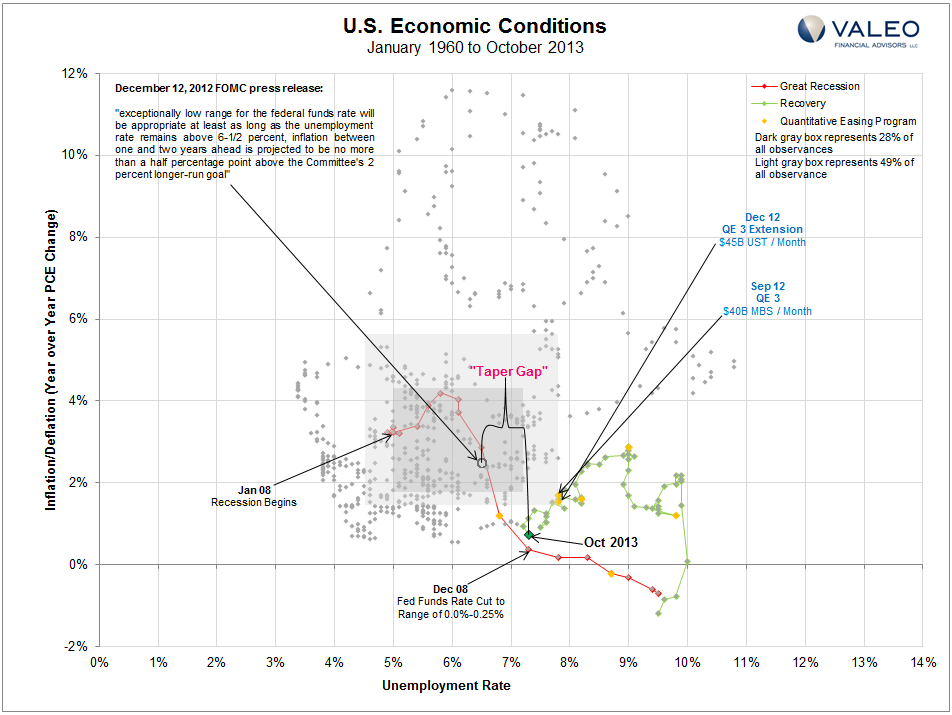
To help put the timing of the Fed’s monetary easing programs into perspective the following chart plots all monthly unemployment rates and year over year inflation readings since January 1960. All gray dots represent a singular month. For example, as of October 2013 the unemployment rate was 7.3% and consumer inflation (PCE) was 0.737%.
The two gray boxes represent, relatively speaking, normal economic conditions in the United States. For more on how these regions were constructed and a historical guide to the U.S. economy see The Fed: Thinking Outside the Box.
Though the unemployment rate continues to improve, consumer inflation remains unusually low. Given the Fed’s dual mandate, to promote both maximum employment and stable prices, it is possible that as long as the $85 billion of bond purchases remains the members remain concerned about the relatively low amount of inflation in the economy.
Any reduction in the amount of bonds purchased by the Fed may indicate that the members feel the economy no longer needs the same monetary support it once did. Meanwhile, there remains a “Taper Gap” between today’s $85 billion per month bond purchases and a point in time when the Fed has indicated it might raise the target for the federal funds overnight interest rate. The closer the unemployment rate / inflation reading gets to that point, the more likely the Fed is to reduce its monthly bond buying purchases.
Data Source: U.S. Department of Labor: Bureau of Labor Statistics, U.S. Department of Commerce: Bureau of Economic Analysis