The cost of a gallon of gasoline has to be one of the most widely watched prices in America. Every time you pull into fill up the gas tank you are reminded that the amount of gasoline that your dollar will purchase is not constant.
The rise or decline in the price of goods and service directly impacts nearly everyone, whether it is the price of a gallon of gas, a loaf of bread, medical care or any other item or service. A change in price can be either positive (inflation) or negative (deflation).
One way to measure the average change in the prices paid for consumer goods and services in America, over time, is to come up with a representative basket of goods and services that the typically American household would, on average, consume. The U.S. Bureau of Labor Statistics consumer price index (CPI) is a widely followed measure of consumer inflation.
Formally the CPI:
“Represents about 87% of the total U.S. population… It is based on the expenditures of almost all residents of urban or metropolitan areas, including professionals, the self-employed, the poor, the unemployed, and retired people, as well as urban wage earners and clerical workers. Not included in the CPI are the spending patterns of people living in rural nonmetropolitan areas, farm families, people in the Armed Forces, and those in institutions, such as prisons and mental hospitals.”
The relative importance of the components in the CPI changes every year. The hundreds of goods and services and their total weighting can be fond at the BLS website.
While the makeup of the basket may not directly coincide with your own expenditure experience, it is representative of the collective.
The most current, major subgroup weights as of 2012:
- Food and beverages: 15.256%
- Housing: 41.020%
- Apparel: 3.562%
- Transportation: 16.875%
- Medical care: 7.061%
- Recreation: 6.044%
- Education and communication: 6.797%
- Other goods and services: 3.385%
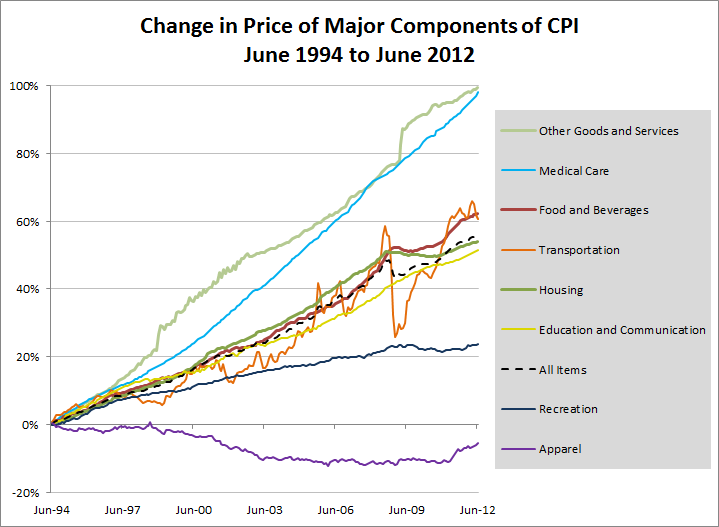
The chart below illustrates how prices have changed for each subgroup from June 1994 to today.
In eighteen years medical care costs have nearly doubled, while apparel (men, women and children cloths along with watches and jewelry) collectively has decreased in price. Transportation which includes volatile gasoline prices has fluctuated the most since 1994, punctuated with a sharp decline during the last recession. Housing (rent, rent equivalent, housing operating expenses, appliances, etc) mostly mirrored overall consumer inflation since 1994, and has only recently begun to rise after stagnating from 2008 to 2011.
