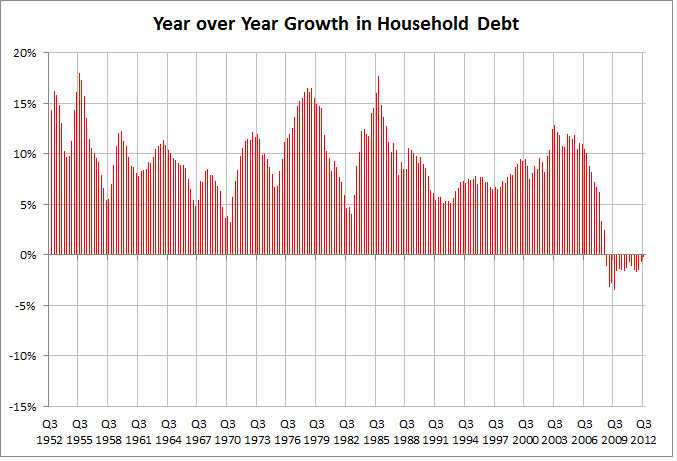
Until the onset of the Great Recession, the amount of household debt in America grew year after year, since at least the early 1950s.
The first year over year decrease in American household debt did not occur until the last quarter of 2008. Since then total household debt has continued to shrink.
Before the last recession in 2008 and 2009, U.S. households collectively increased their debt in proportion to the amount of assets they held. This was possible in part to ever lower interest rates that started in the early 1980s, making it cheaper to service debt (cheaper interest rate payments), and financial innovation, including securitization, which created a liquid market for consumer debt that allowed banks to package up the debt and sell it more easily then ever before.
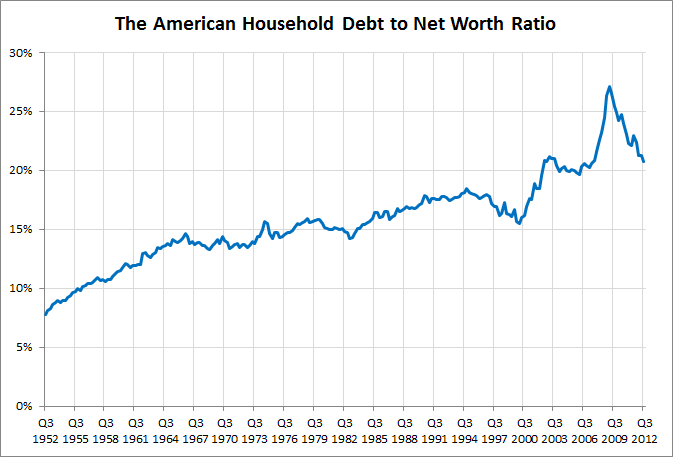
As the amount of debt increased, American households collectively were leveraging their assets to a greater deal. The household debt to household net worth ratio measures the amount of leverage used by consumers. A high debt to net worth ratio generally indicates a more aggressive/risky position as debt payments have to be paid from a smaller equity base.
This debt to net worth ratio increased steadily from 1952 to 1966 before leveling off. From there it stayed fairly constant at 15% until the early 1980s. From that point on, however, there was a general upward trend in the amount of debt to household net worth. Two large spikes in the ratio occurred during the 2001 and 2008-2009 recessions. This is mostly due to the fact that liabilities are much more persistent and not easily paid off or discharged in a short period of time, while equity values fluctuate daily. The difference between the past two recession was that after 2001 the household leveraging continued.
Today the household debt to net worth ratio today stands at the same level it did just prior to the Great Recession in the U.S.
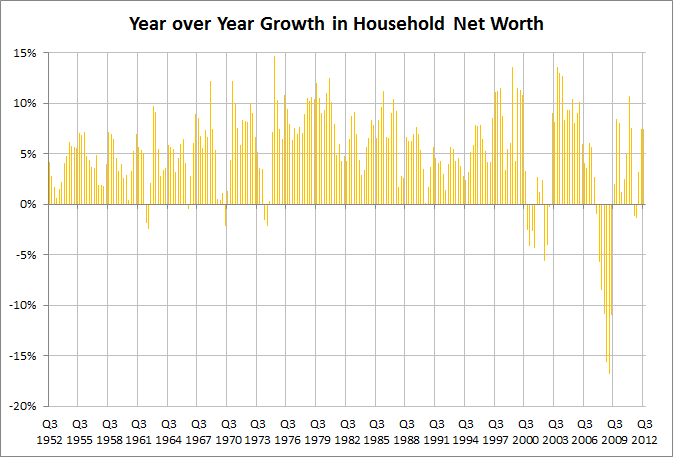
The decrease in the debt to net worth ratio has as much to do with increasing household net worth as it does the shrinking amount of debt.
Until 2000 it was extremely rate to see household net worth decrease over the course of a year. During both the 2001 and 2008 recessions the draw down in net worth were over 5%, with the later seeing a draw-down of over 15% during the depths of the Great Recession. Over the past few years the trend has reversed and collective household net worth have increased as the housing market stabilized and most financial markets have increased in value.
Date Source: Federal Reserve Flow of Funds Accounts of the United States
The equity (net worth) base has proved more volatile over the past decade in part because of the amount of household debt outstanding. If the deleveraging trend continues some of this net worth volatility may decrease, but less household debt may also lead to a decrease in overall demand for goods and services from businesses and a constrain U.S. economic growth.


