Debt is dead, long live debt.
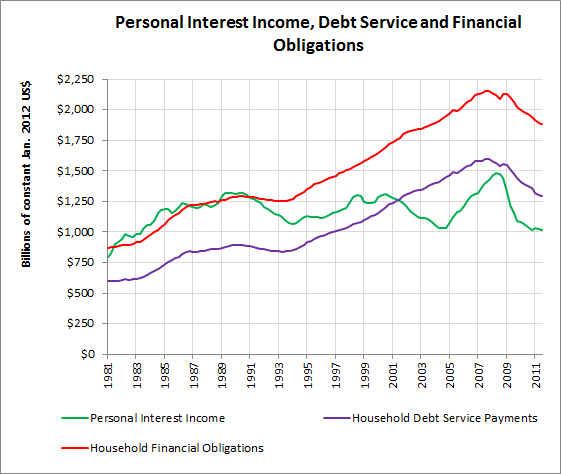
The total amount of interest payments that American household balance sheets could withstand reached a breaking point somewhere in the middle to later part of the 2000s. The age of household leveraging, roughly identified as 1981 to 2008, was over. While the increasing amount of debt Americans were willing to load onto their balance sheet during a period of generally declining interest rates was the story of the great leveraging of the American household balance sheet, the ratio of household interest income to interest expense defined the chapters.
Prologue: 1970 to 1980 – Increasing interest rates and high inflation during a period of weak economic growth meant the debt was expensive for households.
Chapter 1: 1981 to 1991 – Interest rates and inflation peak and will both steadily decline of the next 27 years. Total household financial obligations in the U.S. over the first eleven years of this period were roughly equivalent to the total amount of personal interest income received by households. While total financial obligations increased over theses first eleven years, the rate of growth was equivalent to the amount of personal interest income earned.
Total household financial obligations is a very broad measure of financial obligations including interest payments for mortgages, credit cards, student loans, rent payments, auto leases and other revolving and non-revolving debts, as well as homeowners insurance and property taxes.
Chapter 2: 1992 to 2000 – This period was book-ended by two relatively minor recessions. Initially total household financial obligations leveled off as interest income declined. However, as the economy recovered from the early 1990s recession the broad measure of financial obligations owed by households took off, while interest income remains relatively flat. The amount of personal interest income earned now only exceeded household debt service payments.
Household debt service payments is a narrower definition of obligations owed and includes revolving, mainly credit cards, and non-revolving debt such as mortgages, student loans and autos.
Chapter 3: 2001 to 2008 – Despite a recession in the first part of the decade, both the broad measure of financial obligations and narrower debt service payments continued to rapidly increase while interest income could not close the gap.
Epilogue: 2009 to ? – The age of ever increasing interest payments by households comes to an end. The Federal Reserve vows to keep interest rates low and consumers, both willingly and unwillingly, deleverage bringing down the total burden of interest payments. A lack of expansion in household credit puts a lid on the speed that the economy can grow.
Today, with interest rates at historically low levels and interest income as low as it has been in the past 25 years, managing interest expenditures is as important as ever.
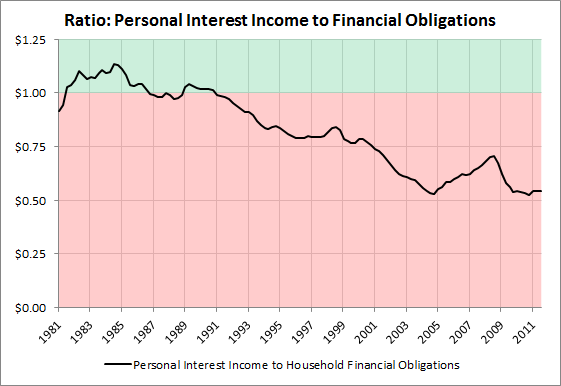
The amount of personal interest income earned by households exceeded the total financial obligations of households from 1982 to 1991. This ratio bottomed out at $0.50 in 2004 and has since returned to a historically low level.
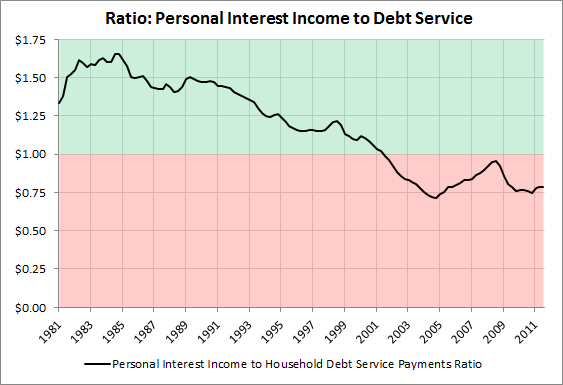
The amount of personal interest income earned by households exceeds the total debt service owed by households until 2001. Today this ratio is less than $1.00 and has stayed relatively steady around $0.75.


