As 2012 came to a close there was fierce debate in Washington D.C. regarding the fiscal cliff, future tax rates and federal spending.
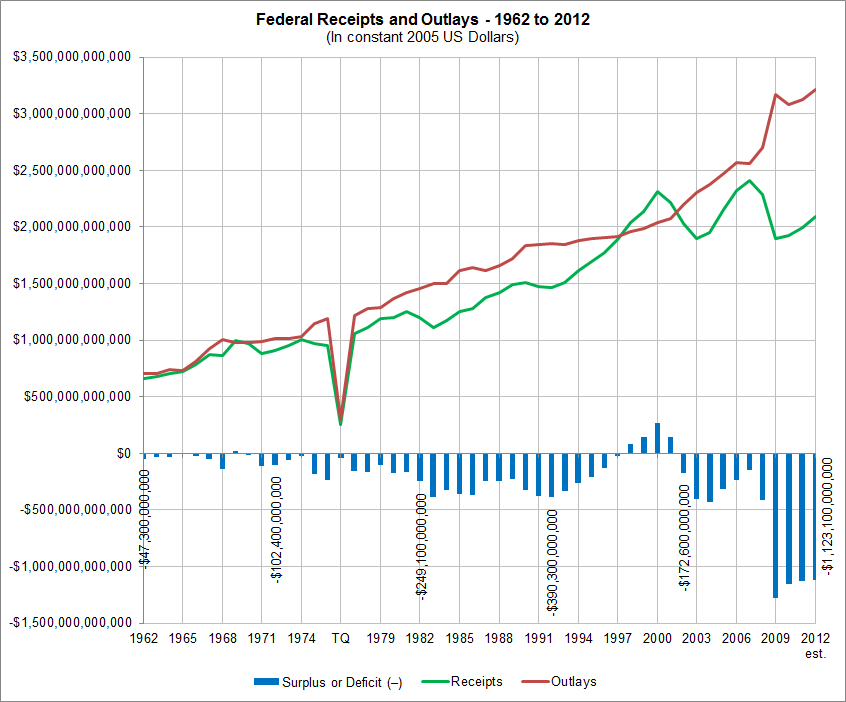
For the past four years, the U.S. Federal government has run an annual deficit of greater than $1 trillion dollars due to a combination of fewer federal government receipts and higher outlays. (All figures are in constant 2005 U.S. dollars in order to provide an apples to apples comparison over time).
Click any chart for a larger view.
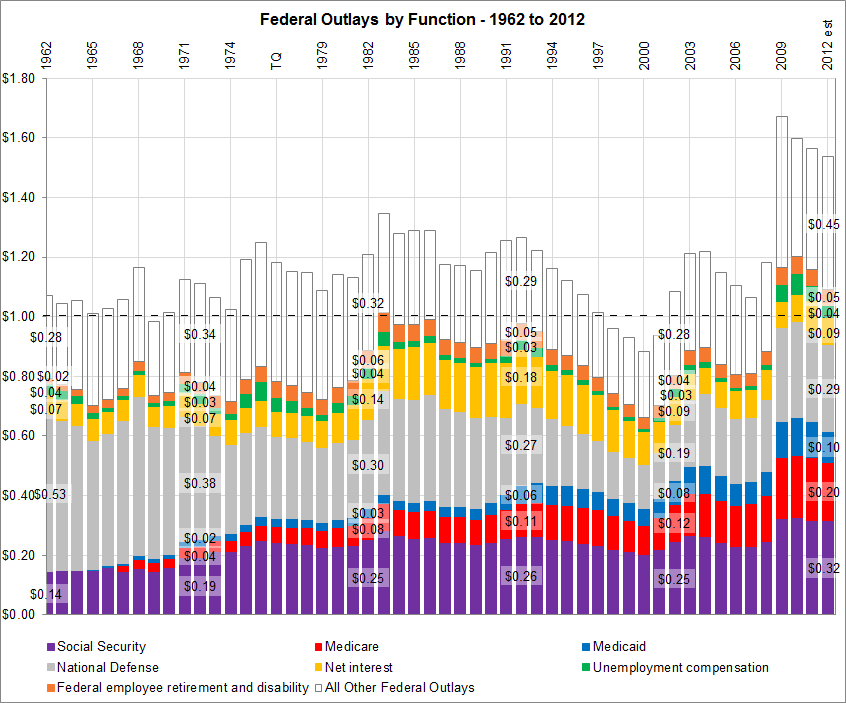
Imagine the federal government taking in a $1.00 bill from receipts; how has that $1.00 been spent over the past 50 years? The following chart breaks it down by some of the largest outlay components.
Data Source: United States Office of Management and Budget
The estimate for 2012 was that $1.54 was spent for each $1.00 received by the U.S. federal government. Outlays for five major areas – Social Security, national defense, Medicare, Medicaid and interest payments on outstanding debt – alone equaled the total amount of federal government receipts for the year.
- $0.32 Social Security
- $0.29 National defense
- $0.20 Medicare
- $0.10 Medicaid
- $0.09 Interest payments on U.S. debt outstanding
- $0.05 Federal employee retirement and disability
- $0.04 Unemployment compensation
- $0.45 All other federal programs, including international affairs, science, energy, agriculture, commerce and housing, transportation, community development, education, health (excluding Medicare and Medicaid), veteran services, justice, general government, national resources and environment
Since 1962, the only years in which the U.S. federal government ran a surplus were 1969, 1998, 1999, 2000 and 2001. In the chart above, the total stacked outlay bars do not reach $1.00 for these years.