According to at least one measure, the United States economy continues to struggle to achieve normal economic growth. The Federal Reserve Bank of Chicago releases the monthly index, Chicago Fed National Activity Index (CFNAI) “designed to gauge over all economic activity and inflationary pressure.”
“The CFNAI is a weighted average of 85 existing monthly indicators of economic activity… A positive index reading corresponds to growth above trend and a negative index reading corresponds to growth below trend.”
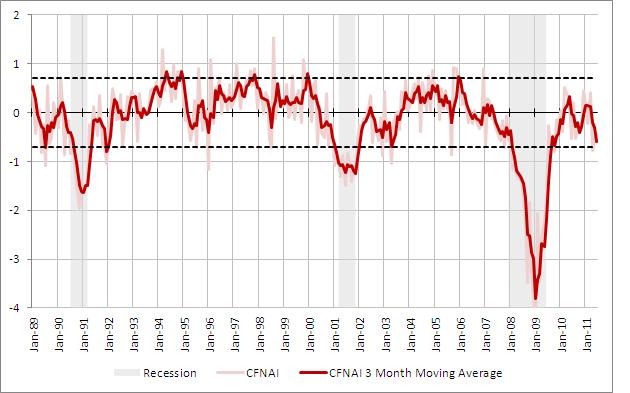
Due to the volatility found in using monthly data (CFNAI), a three month moving average (CFNAI-MA3) provides a more consistent measure of health of the economy.
The CFNAI-MA3 decreased to -0.60 last month from a reading of -0.31 in May. This most recent figure is the lowest level the three month moving average has been since October 2009. The CFNAI-MA3 measure is indicating that economic activity in the United States is below the historical trend and that economic activity is not likely to add to inflationary pressure in the near future.
According to the Chicago Fed, “when the CFNAI-MA3 value moves below –0.70 following a period of economic expansion, there is an increasing likelihood that a recession has begun. Conversely, when the CFNAI-MA3 value moves above –0.70 following a period of economic contraction, there is an increasing likelihood that a recession has ended. When the CFNAI-MA3 value moves above +0.70 more than two years into an economic expansion, there is an increasing likelihood that a period of sustained increasing inflation has begun.”
Chicago Fed National Activity Index
January 1989 – June 2011
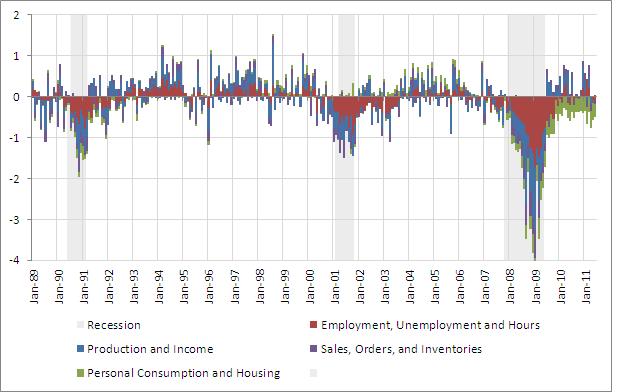
The Chicago Fed states that, “the 85 economic indicators that are included in the CFNAI are drawn from four broad categories of data: production and income; employment, unemployment, and hours; personal consumption and housing; and sales, orders, and inventories. Each of these data series measures some aspect of overall macroeconomic activity. The derived index provides a single, summary measure of a factor common to these national economic data.”
With 85 monthly indicators across four categories, what specifically is causing economic activity to run below trend? To answer this question, the chart below breaks apart the CFNAI into the four major components. It is evident that personal consumption and housing (green shading) is preventing the economy from growing at a level close to trend. Never in the past 22 years has personal consumption and housing been such a drag on the economy.
Chicago Fed National Activity Index
January 1989 – June 2011
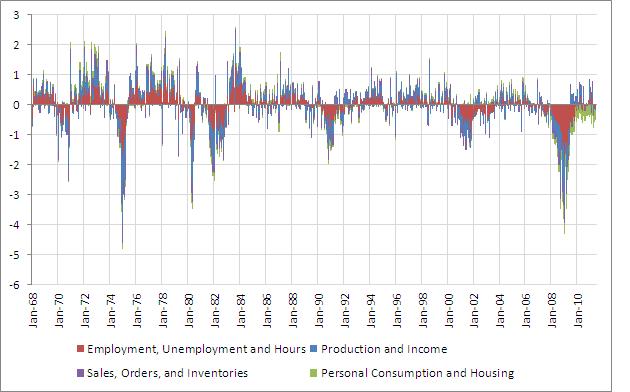
Looking back further in time, it is hard to pick out any period in which personal consumption and housing (green shading) has ever played such a meaningful factor in causing below trend economic activity.


