Every month, the National Association of Home Builders (NAHB) conducts a survey asking respondents to rate the condition of the single family housing market. According to the NAHB, “The survey asks respondents to rate market conditions for the sale of new homes at the present time and in the next 6 months as well as the traffic of prospective buyers of new homes” in their region.
Ultimately the survey results are used to create a national diffusion index where a reading of 50 indicates that an equal amount of builders consider conditions good and bad. A monthly result of greater than 50 signifies that more builders see the single family housing market in their area as good rather than bad, with the opposite being true if the monthly figure is less than 50.
Using the monthly NAHB housing index figures, which can range from 0-100, and the year over year change in the index, the chart below illustrates how home builders surveyed have felt about the housing market. The NAHB index is on the horizontal x-axis and the year over year change in the index is depicted on the vertical, y-axis.
Expansion: (2002-2004) For much of this period the national NAHB housing index was experiencing year over year increases and many home builders viewed current and future conditions as good.
Slowdown: (2005) More home builders viewed the market as good than bad, but the NAHB index was less than the same month a year prior.
Sharp Contraction: (2006-2007): The index fell below 50 during the middle of 2006 and the year over year change consistently fell.
Contraction to Recovery: (2008-2011) The year over year change in the index bounced between -20 and 10, but the index level remained at very low levels, about 10-20.
Recovery: (2012-present) The year over year reading change improved each month , but nationally, the index has yet to rise above 50.
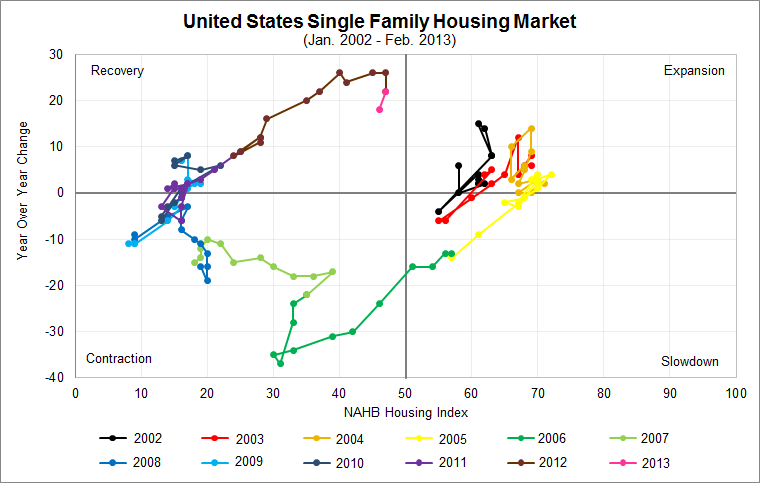
Data Source: National Association of Home Builders
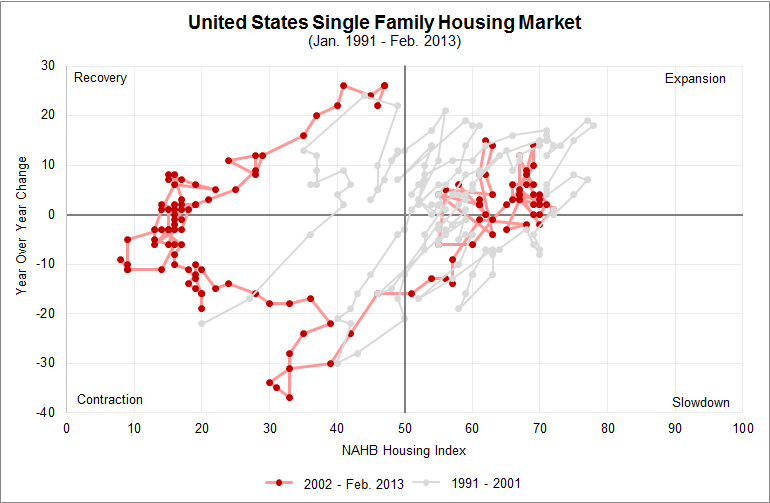
Using data going back to January 1991, it is clear that the national index has previously spent a significant amount of time in expansion territory, however it did not dwell in the contraction or recovery zones for very long like it has for the past seven year.
Data Source: National Association of Home Builders