During the Great Recession, December 2007 to June 2009, the U.S. economy contracted by over 5%. This was the most that the economy has shrunk since the Great Depression of the 1930s.
The unusually steep draw down of the U.S. economy was not the only uncommon part of the last half dozen years. The recovery from the recession has also been atypical as the economy continues to run below its economic potential.
Today, real potential gross domestic product (GDP) stands well above real actual GDP.
GDP measures the size of the U.S. economy and is the market value of all final goods and services produced within the country in a years time.
Potential GDP is an estimate of what the output of the U.S. economy would be over a year with a high rate of use of both capital and labor. Potential GDP is the level at which the U.S. economy could remain stable over the long run.
Putting GDP and potential GDP data in real terms makes historical periods comparable to today.
At the end of last year the ratio of real GDP to real potential GDP stood at 94.1%, which means that the U.S. economy is operating below the theoretical potential. While the ratio is off the lows of the 2009 levels it has been unusual for it to remain this significantly depressed for as long as it has.
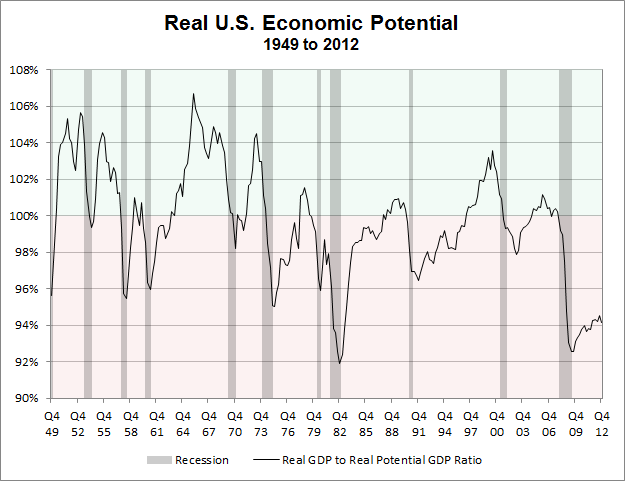
Data Source: U.S. Congressional Budget Office