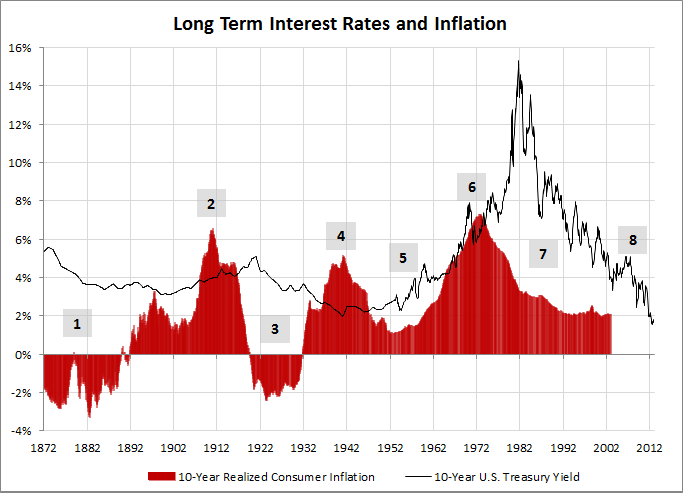
This summer the 10-year U.S. Treasury note traded with a yield of 1.39%. As the black line in the chart below illustrates, this is the lowest rate since at least 1872.
Assuming the U.S. does not default on payments, the real return on the U.S. government debt, if bought by a U.S. citizen at issuance and held to maturity, is primarily the interest minus inflation over the time period the bond is held. The other portion of the return is from the interest earned on the reinvestment of coupon payments, which could be at a higher or lower rate depending on what the new interest rate is at the time the coupon was received While important in calculating the total real return, the interest rate earned on the reinvestment of coupon payments are a smaller portion of the overall return and will be, for simplicity sake, assumed to be able to be reinvested at the original interest rate.
During January 1952, the 10-year U.S. Treasury bond yield was 2.68% (see black line in chart). Over the next ten years consumer prices increased by an average of 1.04% (see red bar at January 1952). The real annualized return was therefore 1.64% (2.68% minus 1.04%) – again this assumes that all coupons were able to be reinvested at the 2.68% rate.
It is, of course, impossible to know precisely what inflation will be over a ten year holding period, but in this example, the low nominal yield of 2.68% in January 1952 was higher than inflation was from January 1952 to January 1962.
Since 1872 the real return has gone through periods in which the real return on a 10-year U.S. Treasury bond has been positive and negative. The positive real return periods, on average, been close to 25 years in length, while the negative real return periods have been shorter, averaging just over 9 years.
Positive real yield
1. January 1872 to December 1907 (35 years 11 months)
3. July 1916 to June 1936 (19 years 11 months)
5. November 1946 to September 1964 (17 years 10 months)
7. January 1974 to at least December 2002 (28 years 11 months)
Negative real yield
2. January 1908 to June 1916 (8 years 5 months)
4. July 1936 to October 1946 (10 years 3 months)
6. October 1964 to December 1973 (9 years 2 months)
Yet to be determined
8. January 2003 to today (10 years). The average one year inflation rate has been close to 2.5% since 2003.
Data Source: Online Data - Robert Shiller. Yale, 18 December 2012.