In 2012 the market value of all final goods and services produced in the world was close to $85 trillion. This number is referred to as the gross domestic product (GDP). To compare different countries a form of GDP called the purchasing power parity (PPP) is used.
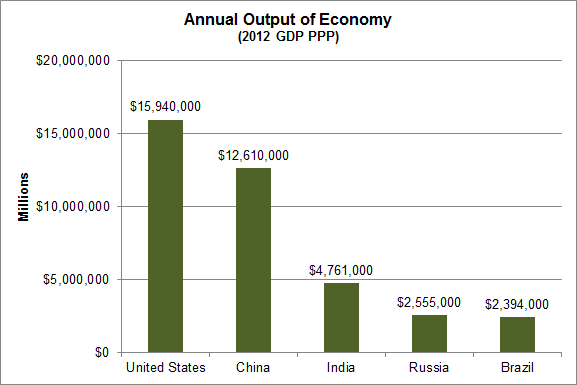
Of the $85 trillion produced globally in 2012, just under 19% was from the United States. The first chart below compares the 2012 GDP to a few large emerging market economies.
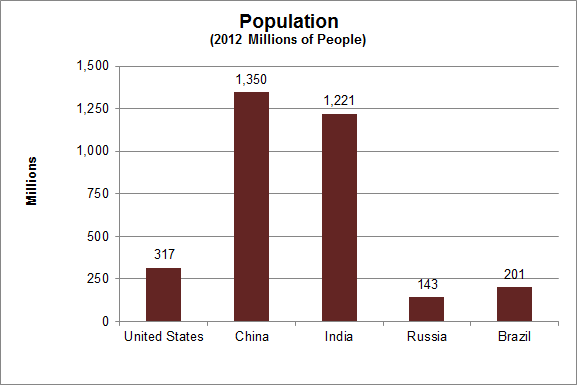
The selected countries represent some of the most populous in the world; United States 3rd, China 1st, India 2nd, Russia, 9th and Brazil 5th.
Dividing the annual GDP by the number of people in the country results in a GDP per capita figure, a proxy for the overall national standard of living. It is however, not an indication of personal income or illustrate how equal the distribution of wealth is throughout an economy.
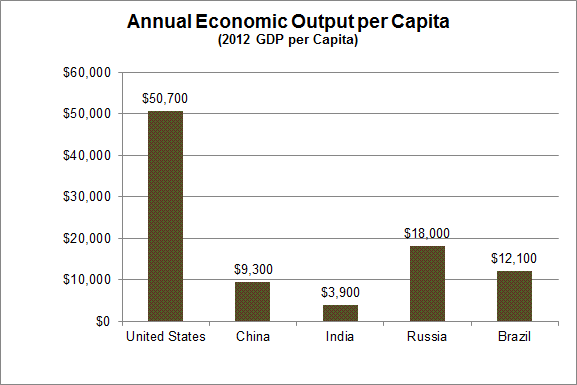
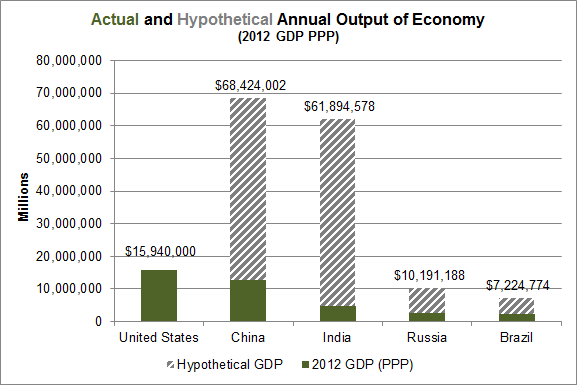
With the above in mind, how big would the Chinese, Indian, Russian and Brazilian economies be if their GDP per capita was the same as the United States, $50,700?
To reach the GDP per capita of the U.S., the annual output from China, India, Russia and Brazil would all have to be significantly larger, 5x, 13x, 4x and 3x respectively, than current levels.