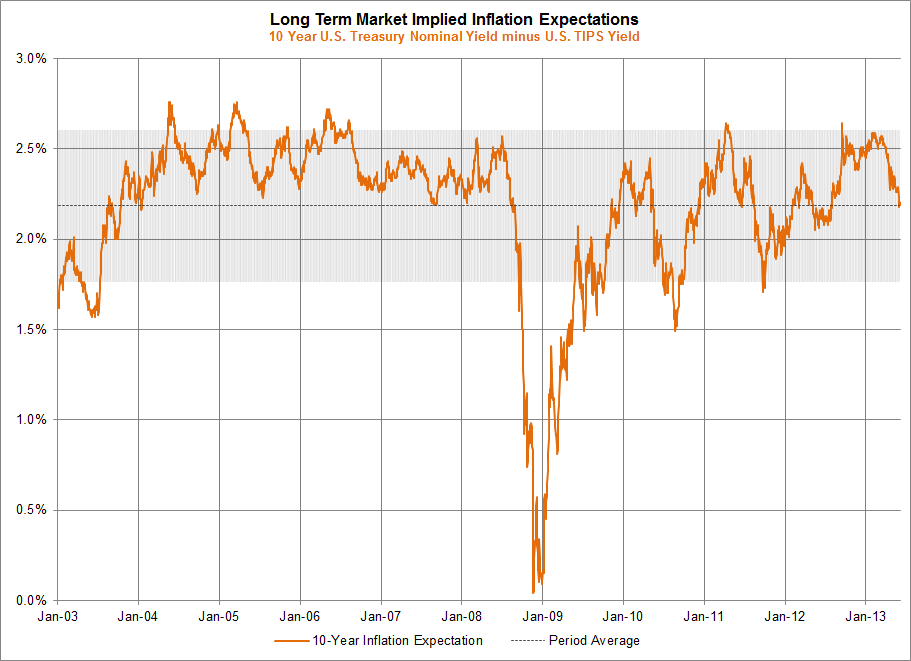
In the last week, the ten year market implied expectation for annual inflation fell to 2.18%, the lowest level since July 2012. The downward trend began at the tail end of January 2013 and has now reached the long term (2003 through this week) average.
Due to the extremely low implied inflation expectations during the Great Recession of 2008 the long term average is skewed lower that it would be prior to 2008. The average from 2005 to 2007 was just under 2.5%, a level the 10 year spread has only briefly flirted with since 2008.
Similarly market implied inflation expectations for the next five years have moved lower since the the end of January 2013 and are currently lower than the 2003 through this week average. Interestingly, five year inflation expectations never attained pre-2008 recessionary levels.
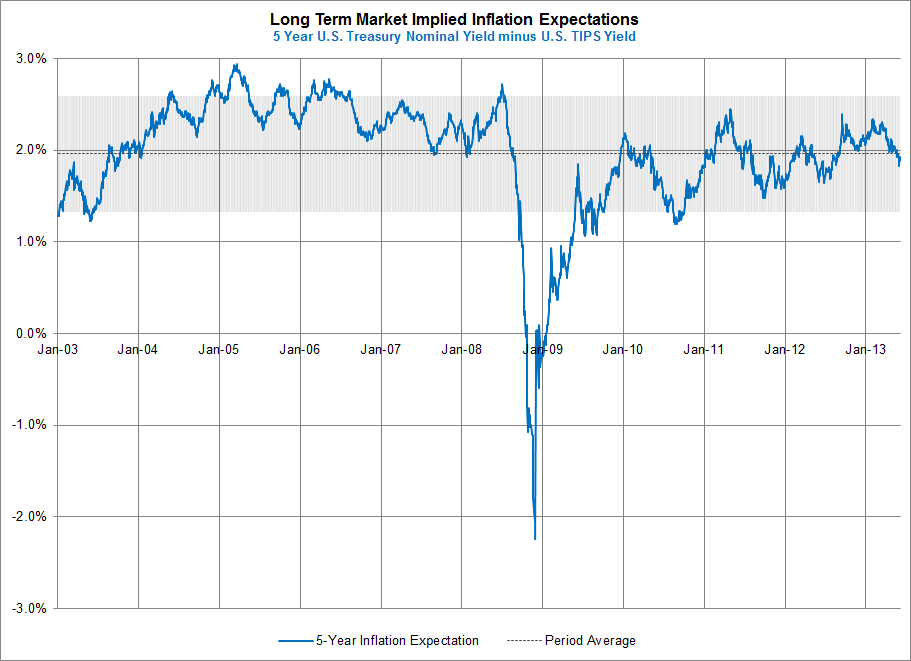
One way to gauge the markets expectations for inflation over the long term is to take the yield on the 10-year U.S. Treasury Bond and subtract the 10-year U.S. Treasury Inflation Protected Security (TIPS) bond yield. This difference (or spread) can be viewed as the expected inflation over the term of the bonds. Both charts use constant maturity U.S. Treasury and U.S. TIPS values.