The return on an investment has as much to do with the purchase price as it has to do with the sale price.
Using 250 day periods (there are typically between 250 and 254 trading days in a year) to calculate both the return on an investment and the volatility experienced over that time period, depicts just how different 250 day holding periods can be for any one investment.
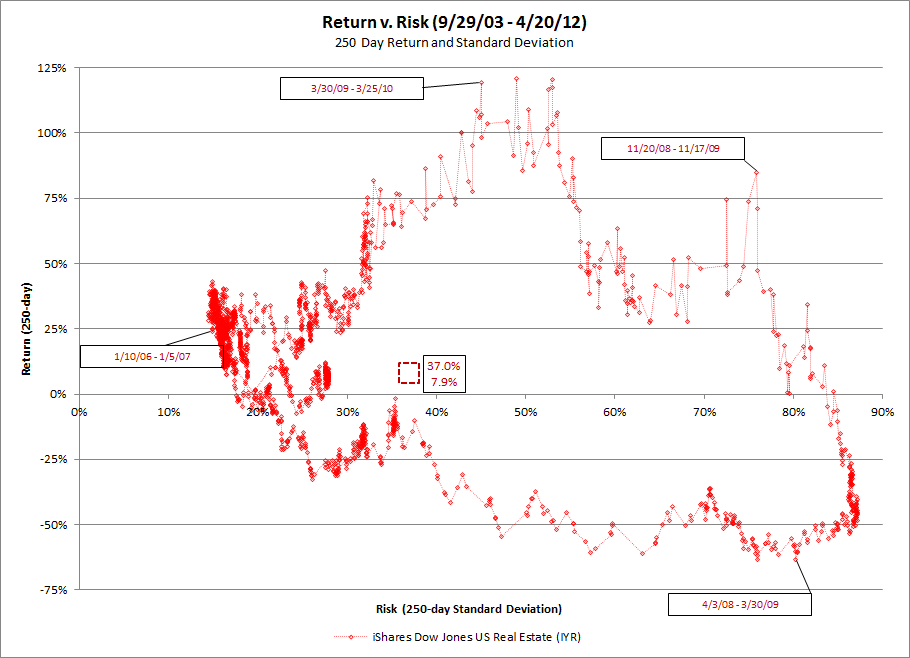
For example looking at all of the 2,156 possible 250 day holding periods from 9/29/03 – 4/20/12 for the iShares Dow Jones US Real Estate ETF (IYR) illustrates how different various 250 day holding period returns and volatility were during the over eight year period. This ETF tracks an index composed of U.S. real estate holding and development companies and real estate investment trusts.
From 1/10/06 – 1/5/07 the return of IYR, including dividends, was 24.6% with a standard deviation (a measure of price volatility) of 15.0%. From 4/3/08 – 3/30/09, after the real estate bubble popped, the return was -63.2% with 80.1% standard deviation, a poor return with a lot of volatility. Starting, just over seven months later, 11/20/08 – 11/17/09 the return was a positive 84.8% with 75.9% standard deviation; a high return, but with a great deal of volatility.
The average 250 day return, including dividends, over this very volatile time period, that is the IYR was held from the entire time from 9/29/03 – 4/20/12, was 7.9% with a standard deviation of 37.0%. This is depicted in the chart below with a red box with dashed lines.
Click on any chart for a larger view
Statistics for the SPDR S&P 500 (SPY), a measure of the 500 largest U.S. stocks by market capitalization.
Click on any chart for a larger view
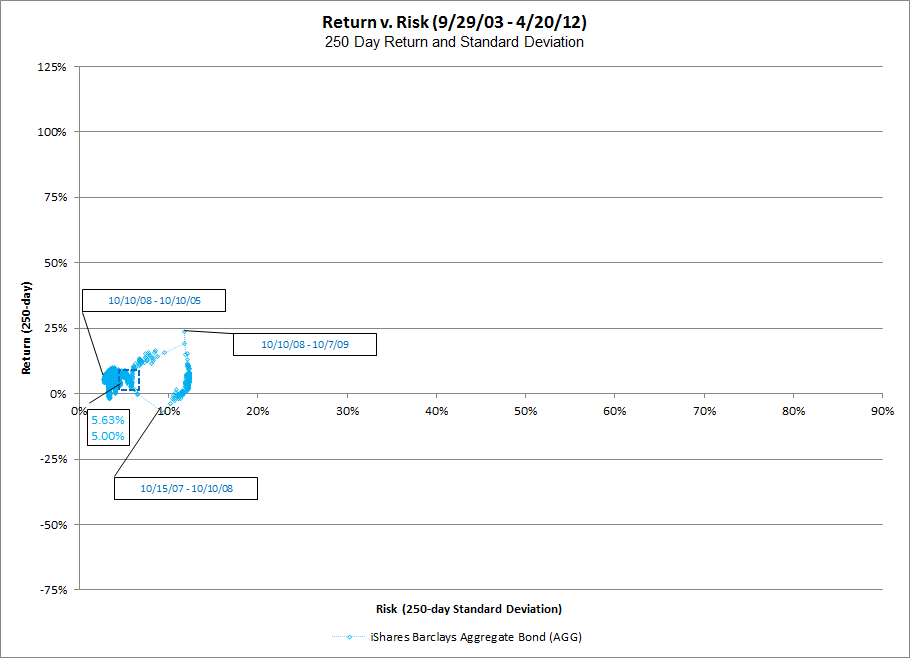
Statistics for the iShares Barclays Aggregate Bond (AGG), which tracks an index that measures the performance of the total United States investment-grade bond market.
Click on any chart for a larger view
Data for all three of the charts above combined into one.
Click on any chart for a larger view


