One way to monitor market expectations for future inflation is to measure the spread between the yield on a U.S. Treasury note and the yield on a U.S. Treasury Inflation Protected Security (TIPS) note. While the principal of a U.S. TIPS security increases for inflation, the nominal U.S. Treasury note does not.
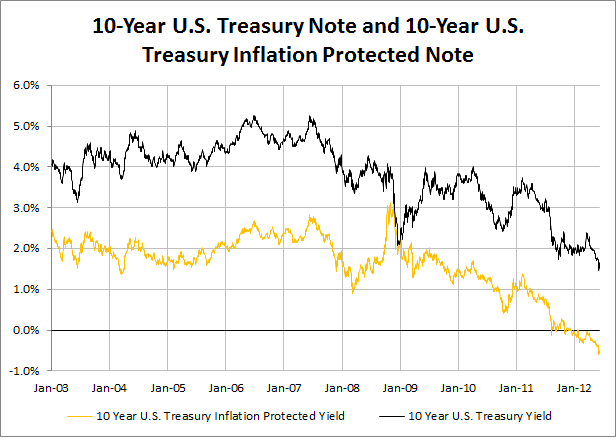
Currently, the 10-Year U.S. Treasury is priced to yield 1.65% and the U.S. TIPS is priced to yield -0.5%. As the first chart below illustrates, this is as low as 10 year rates have been over the past decade. In fact, the 10-Year U.S. Treasury note hit an an time, record low yield of 1.44% this week.
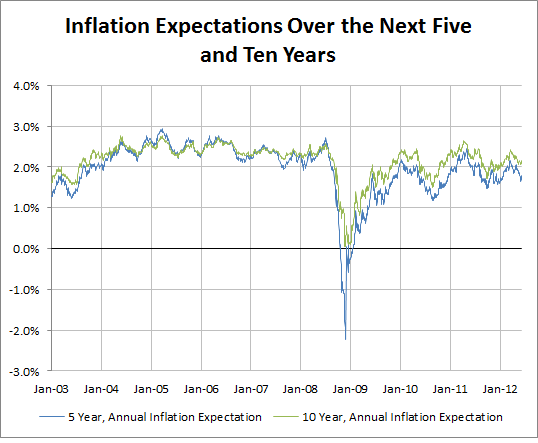
If the 10-Year U.S. TIPS yield is subtracted from the 10-Year U.S. Treasury (nominal) yield the resulting spread is the market expectation for inflation over the next ten years. In the chart below the green line represents the annual inflation expectation over the next ten years according to this spread. Prior to the Great Recession in 2008, the expectation was that inflation would be between 2% and 3% per year. This is fairly typical during non-recessionary years. Once the crisis hit, inflation expectations plummeted and deflation was expected. However, as the U.S. economy began to recover, annual inflation expectations (over the next 10 years) rose and have been between 1.5% and 2.5% for four years.
A major difference between inflation expectations pre-financial crisis, and after, is the timing of projected inflation. In the first chart below, the blue line represents annual inflation expectations over the next five years and the green line represents the annual inflation expectations over the next ten years. Before the middle of 2008, inflation over the next ten years was expected to be similar in years 1-5 and years 6-10. Over the past four years the prospects of near term inflation (years 1-5) and far term inflation (years 6-10) have diverged.
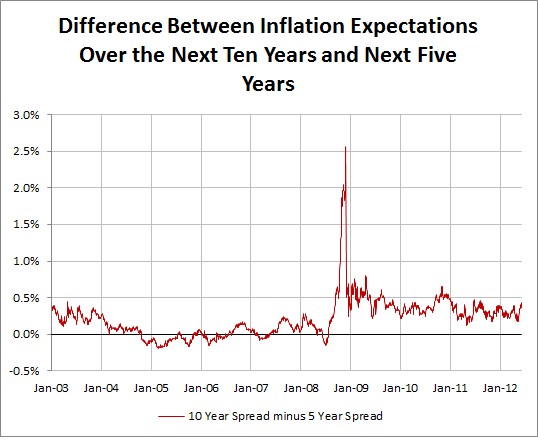
For over four years now the market has expected inflation to be higher in the long term (years 6-10) than during the near term (years 1-5). This can be inferred by measuring the spread between the green line, 10-year inflation expectations, and the blue line, 5-year inflation expectations. The resulting spread is illustrated in the final chart by a red line. For four years the market has consistently expected inflation in years 6-10 to be higher than it will be in years 1-5.
The spike of the spread during the financial crisis is an interesting side note. During this period of time inflation was projected to be much high in years 6-10 then it was in years 1-5. However, this was not an expectation of runaway inflation, because at that point in time, the market was pricing in deflation for the period of December 2008 to December 2013 and then a return to very low inflation after 2013.


