Over the course of the summer, interest rates moved higher rather suddenly. The 10-year U.S. Treasury note rose from a 1.61% in early May to over 2.8% this week. Meanwhile the 5-Year U.S. Treasury note soared from 0.64% in May to 1.58% this week. Despite this lurch higher in rates market implied inflation expectations did not follow this move step for step. Inflation expectations over the next five and ten years first dipped in May and June, before starting to to rise in July and August. Both remain just below historically normal levels.
One way to gauge the markets expectations for inflation for a future period of time is to take the yield on a U.S. Treasury Bond and subtract the U.S. Treasury Inflation Protected Security (TIPS) bond yield. This difference (or spread) can be viewed as the expected inflation over the term of the bonds. Both charts below use constant maturity U.S. Treasury and U.S. TIPS values. The 5-year and 10-year annual implied inflation expectations are displayed in the first chart below.
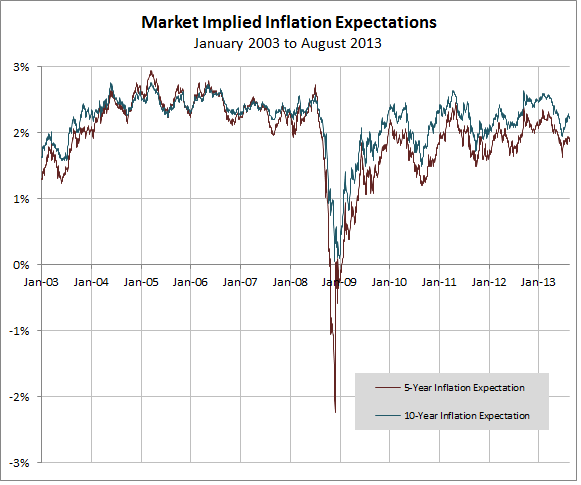
Data Source: Board of Governors of the Federal Reserve System
This summer, with interest rates and the five and ten year inflation expectations rising, one item that did not move much was the market implied timing of inflation. The difference (spread) in the chart above between the 10-year and 5-year inflation expectation continues to remain wide. The chart below shows this spread.
One way to interpret this stable spread is that there is an expectation for near term inflation (the next five years) to be less than that of far term inflation (years six to ten).
Looking at the chart below regarding the timing of market implied inflation there are three distinct periods.
- 2004-2007 (Economic expansion): Cumulative inflation in years 1-5 is expected to be about the same as in years 6-10.
- 2008 (Financial crisis): Cumulative inflation in years 1-5 is expected to be far less than in years 6-10. In fact, the market was pricing in deflation over the first five year period.
- 2009-2013 (Tepid economic recovery): Cumulative inflation in years 1-5 is expected to be less than it is in years in years 6-10.
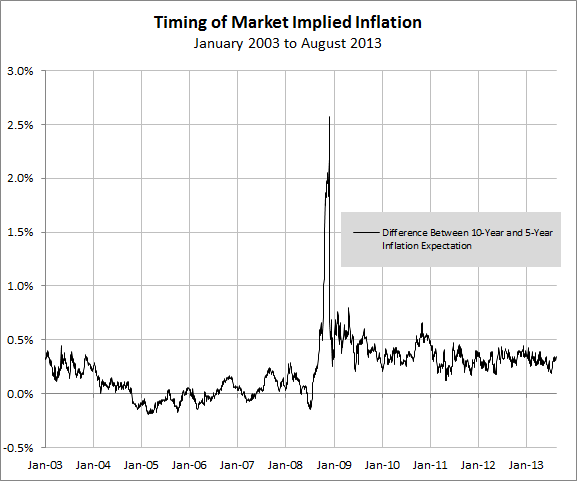
Data Source: Board of Governors of the Federal Reserve System
One takeaway from the current levels of market implied inflation is that annual inflation over the next ten years is expected to be close to a historical average of just over 2%, but over the next five years it is expected to be less than normal. Therefore, the timing of market implied inflation is that there will be less inflation in the near term (years 1-5), than there will be further out (years 6-10).