As 2012 comes to a close, here is an illustrated recap of the themes of the year.
Click on any chart for a larger view.
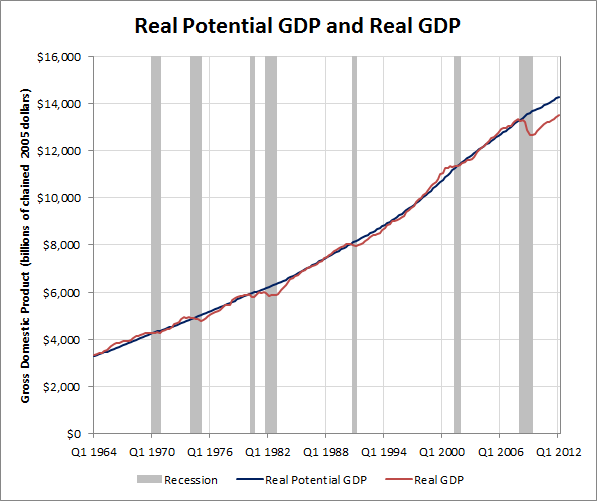
U.S. Economic Growth
Though the U.S. economy has been growing since the second half of 2009, it continues to run below its potential.
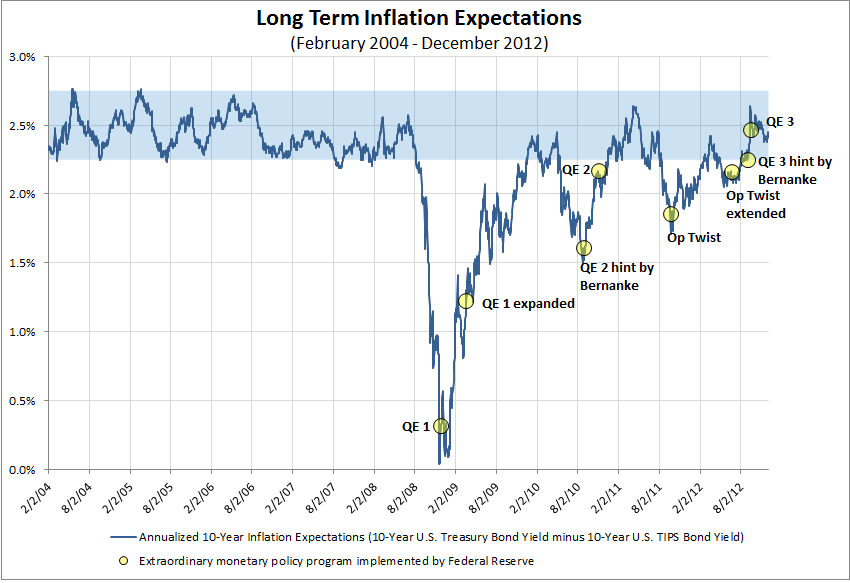
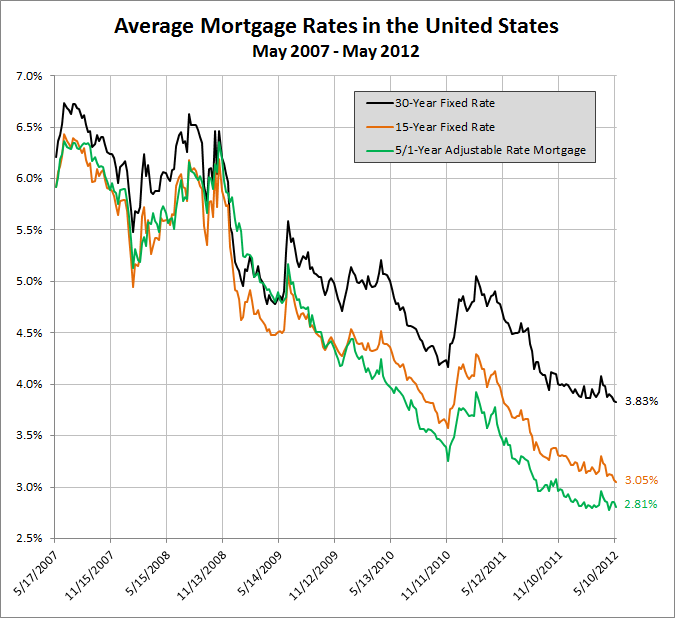
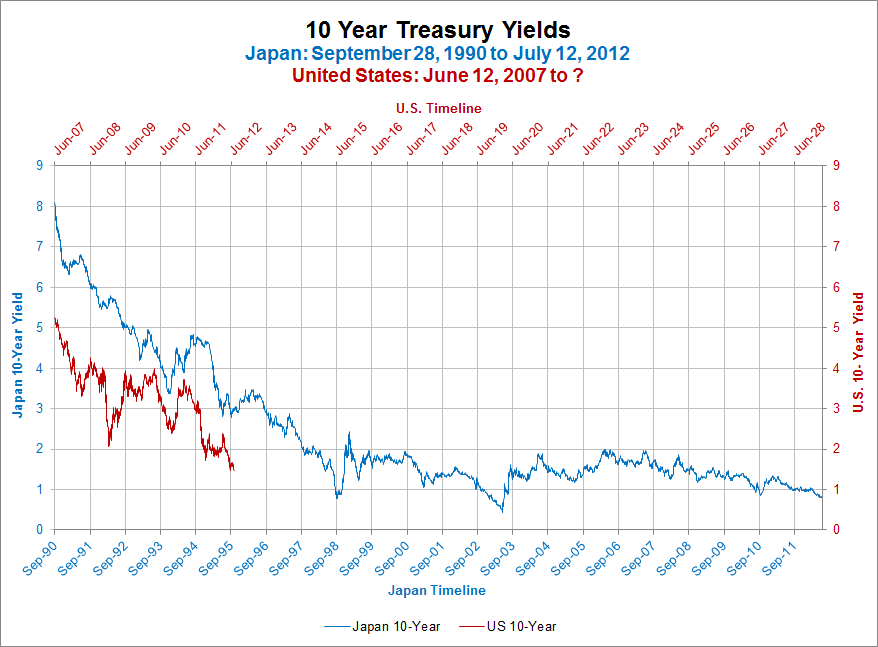
Inflation and Interest Rates
Current inflation expectations are within a more “normal” 2.25%-2.75% range, but this likely has been, in part, due to the Federal Reserve’s multiple quantitative easing (QE) programs.
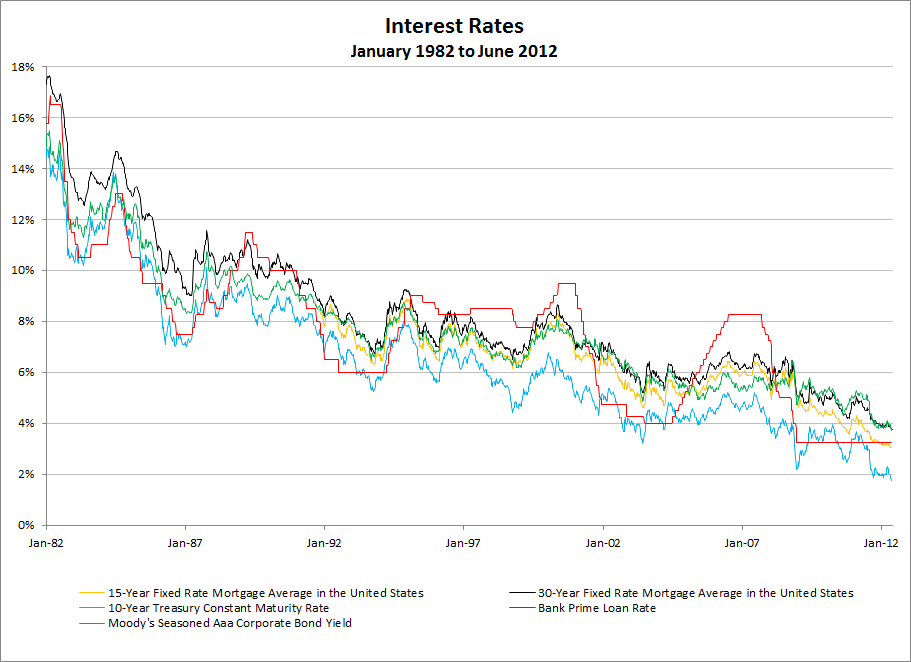
Interest rates have remained at historically low levels, a plus to borrowers, minus to savers.
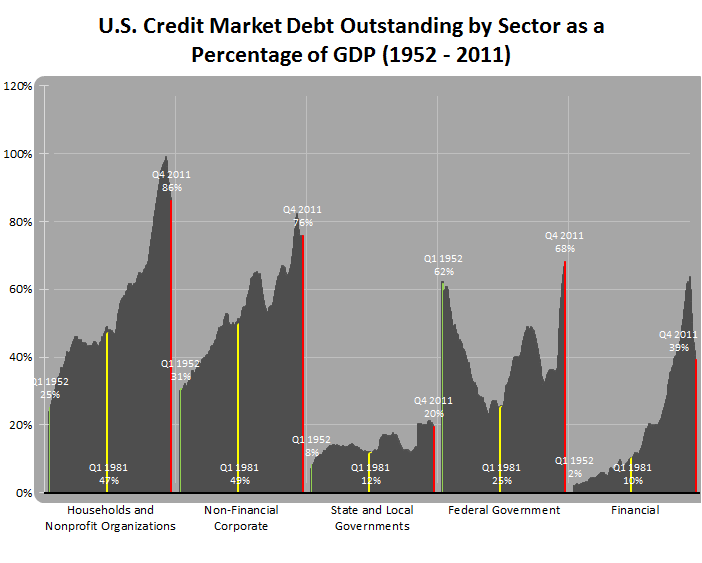
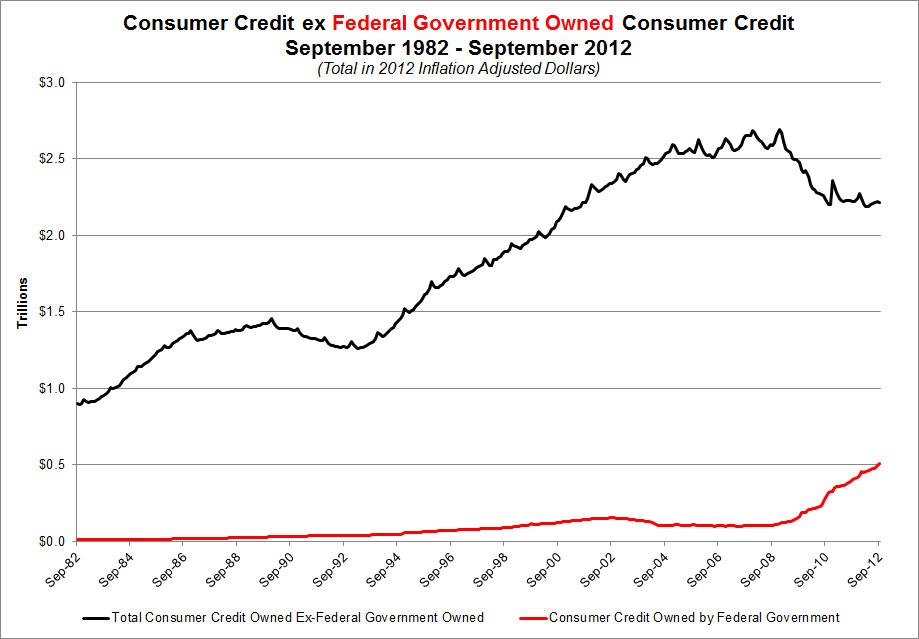
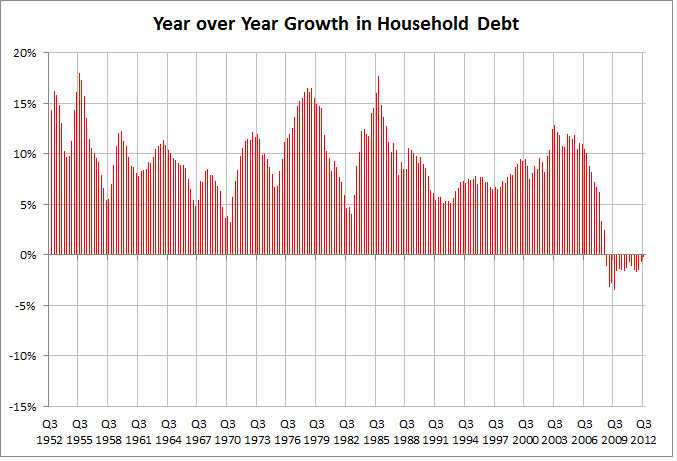
Deleveraging
The only sector that collectively added debt last year was the Federal Government.
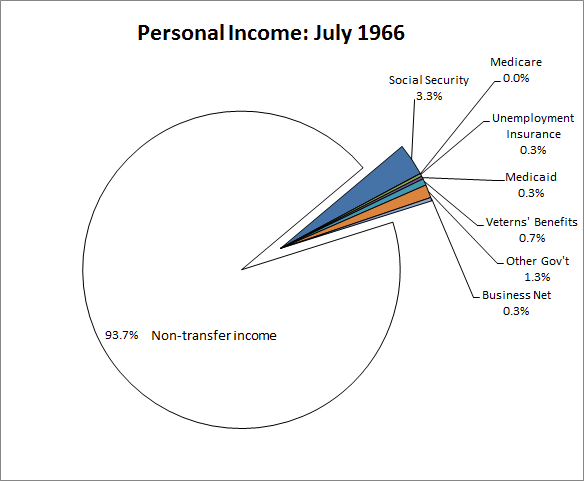
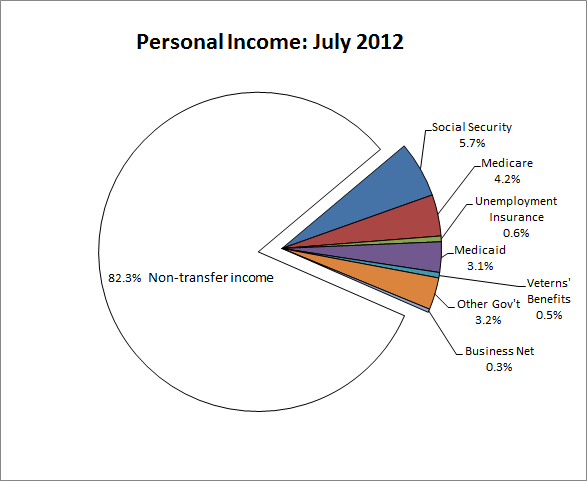
Income
In 1966 less than 7% of personal income came from transfer sources. This year nearly 18% of personal income came from transfer sources with Social Security (5.7%) and Medicare (4.2%) leading the way.
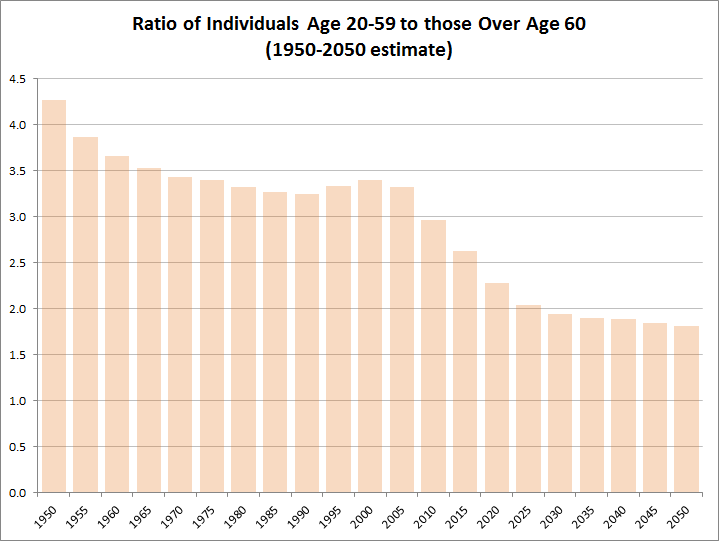
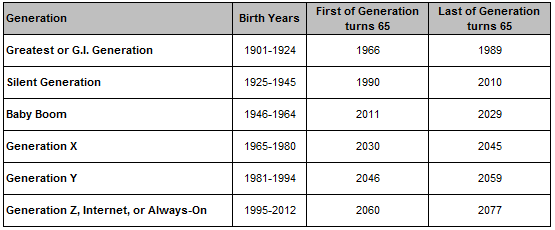
Demographics
The number of people between 20 and 59 (prime working age) to those over the age of 60 has dropped to below 3 to 1 and is expected to fall to 2 to 1 in twelve years.
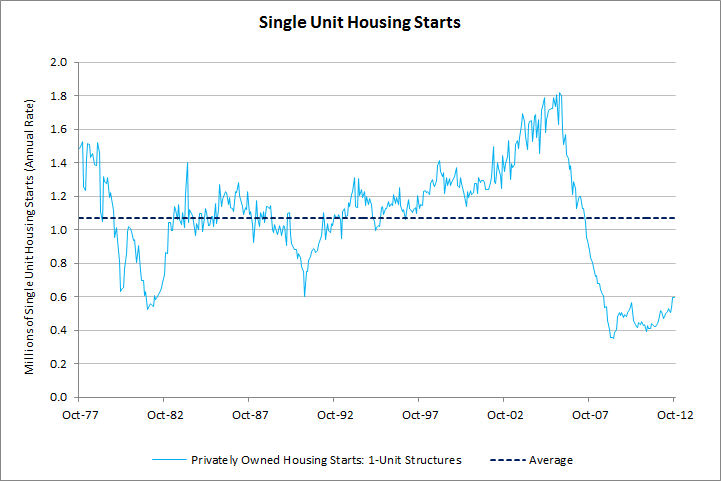
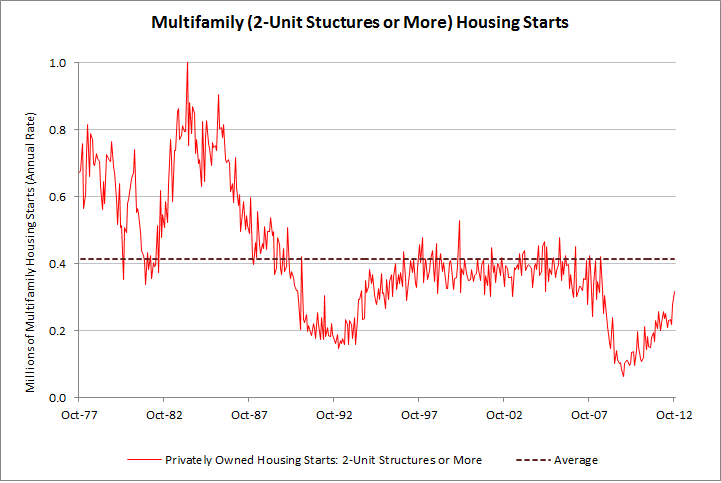
Housing
Single family housing has increased from 2008 lows, but remain depressed.
Multifamily housing is closer to the long term average than single units, but is not there yet.
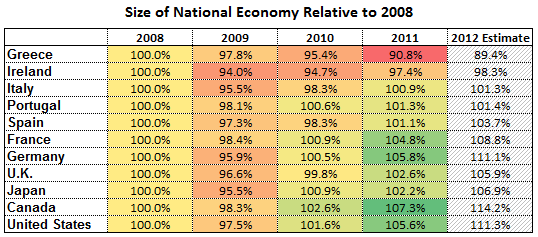
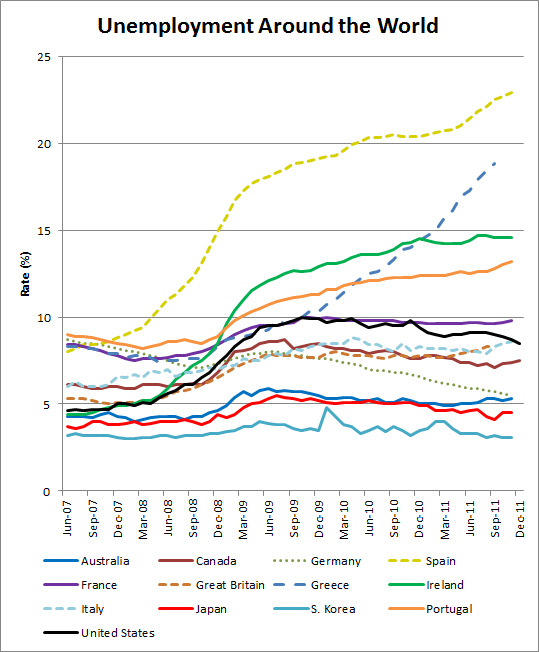
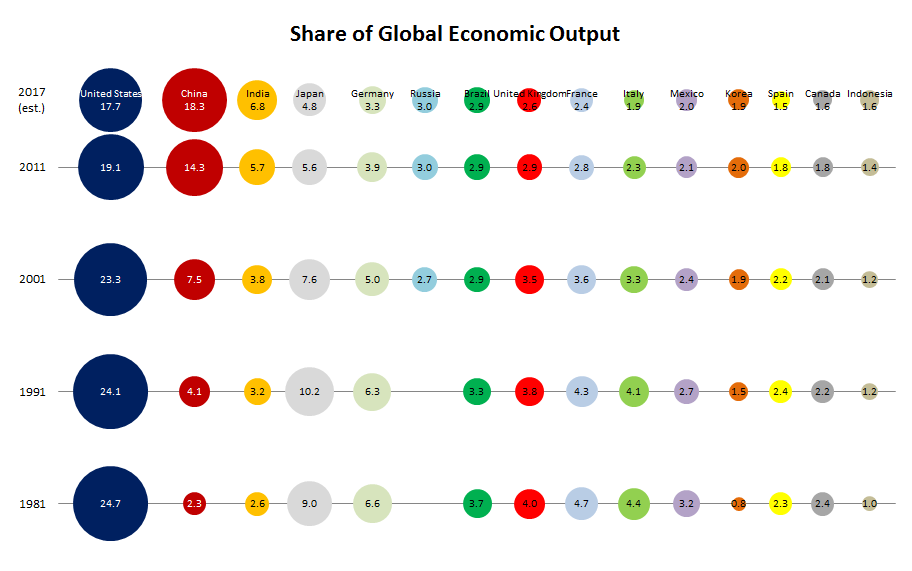
Global Economy
The recovery from the global Great Recession from 2008-2009 has been unequal among developed countries.
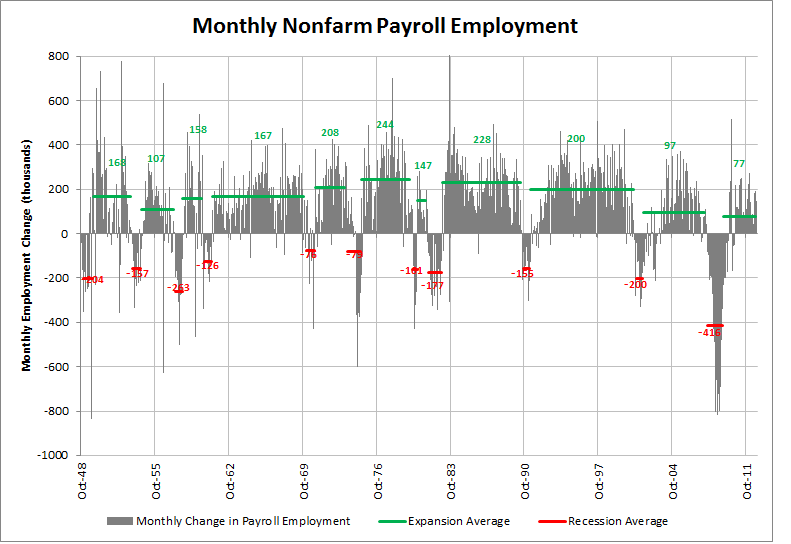
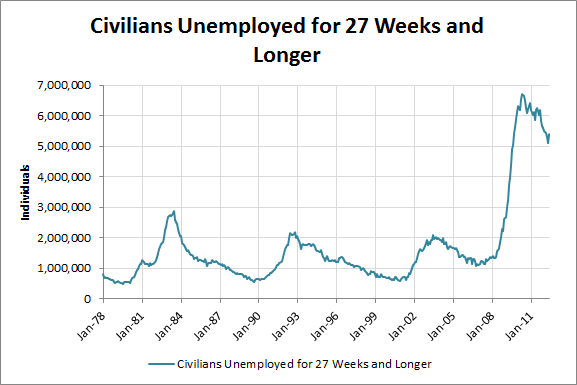
Employment in the U.S.
Through the middle of this year the U.S. had only been adding 77,000 jobs per month since the end of the Great Recession. This is well below all other post World War II recoveries.
Compounding the problem is the number of individuals who have been unemployed longer than 27 weeks.
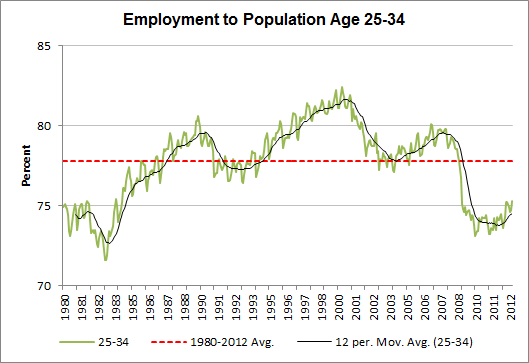
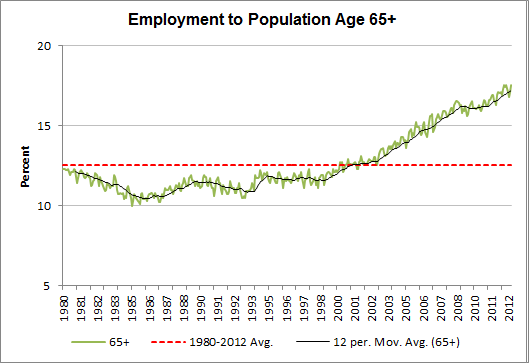
The employment to population ratio is below the long term average for all but people between the ages of 55-64 and 65+.
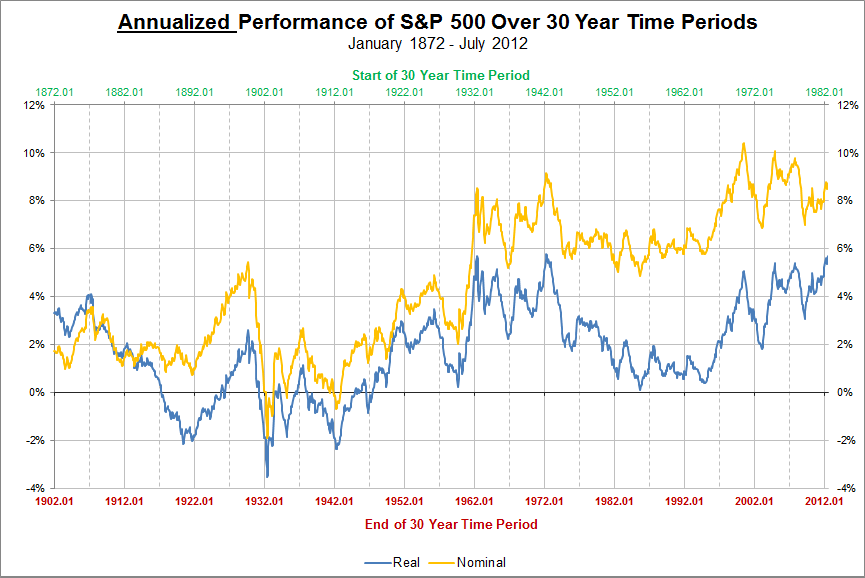
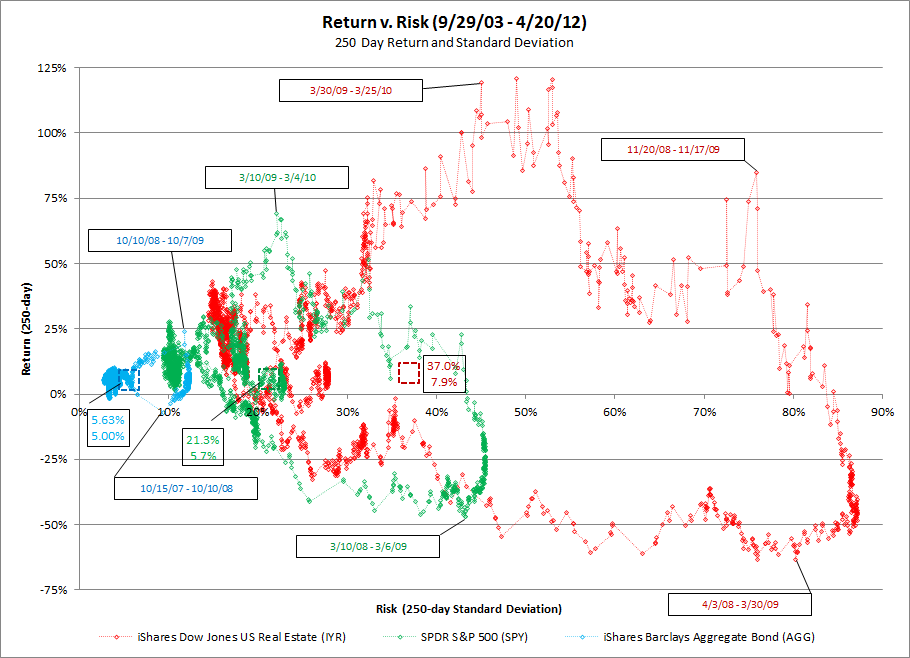
Investing
One year returns for U.S. equities (S&P 500), U.S. fixed income (Barclays Aggregate Bond) and U.S. Commerical Real Estate Investment Trusts (Dow Jones U.S. Real Estate) varied widely during the last decade.
The last time a thirty year U.S. equity return before inflation was below an annualized 7% per year return was for the period from 1967 to 1997. After inflation returns, for thirty year holding periods, have also been unprecedented.