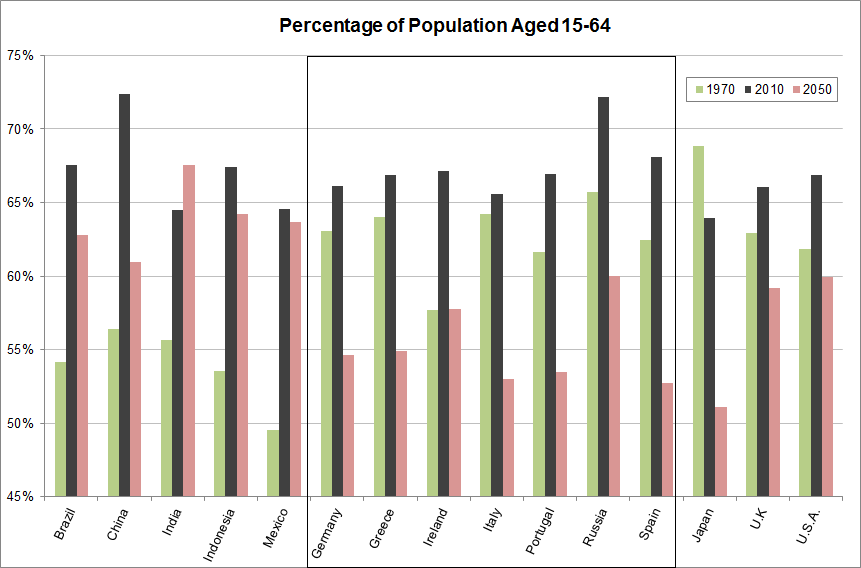
Two prominent demographic trends over the past half century, for much of the world, have been smaller family sizes and increasing lifespans.
From 1970 to 2010 the percentage of the population that can be classified as working age (15-64 years old) increased for most nations around the globe. For example, the percentage of the population that was working age in the United States was 62% in 1970 and reached 67% in 2010.
For the group of countries often referred to as the BRICs – Brazil, Russia, Indian and China, the percentage of the population that was of working age increased substantially from 1970-2010.
- Brazil – 54% to 68%
- Russia – 66% to 72%
- India – 56% to 64%
- China – 56% to 72%
Data Source: United Nations, Department of Economic and Social Affairs, Population Division
The working age population is responsible for a lions share of personal income in a nation, a large portion of consumer spending and charged with contributing to social programs. Demographics can therefore provide a useful backdrop for economic expectations.
Due, in part, to aforementioned demographic trends, the percentage of the population that will be of working age in 2050 is expected to fall in a number of countries. In fact, of the countries listed above, only India is expected to see an increase in this ratio. (Mexico is expected to see a slight decline). The real significant trend, however, is just how much this ratio will shrink for many nations, primarily western Europe and Japan.
- Germany – 66% to 55%
- Greece – 67% to 55%
- Ireland – 67% to 58%
- Italy – 66% to 53%
- Portugal – 67% to 53%
- Spain – 68% to 53%
- Japan – 64% to 51%
