How Americans Spend Their Money
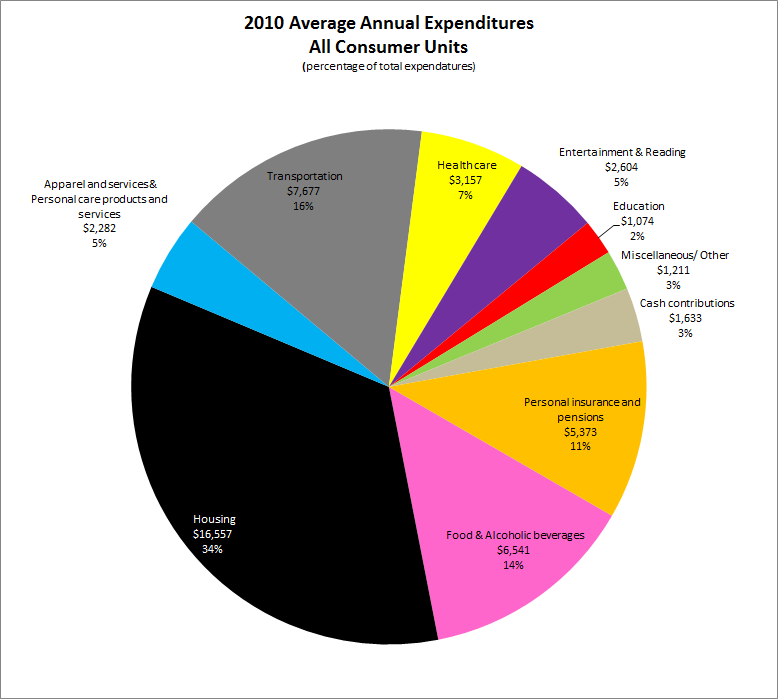
In 2010 the average post-tax income for a “consumer unit” (families and single consumers) in America was $60,712. Average expenditures totaled $48,109 over the course of the year. Here is the breakdown of how the $48,109 was spent.
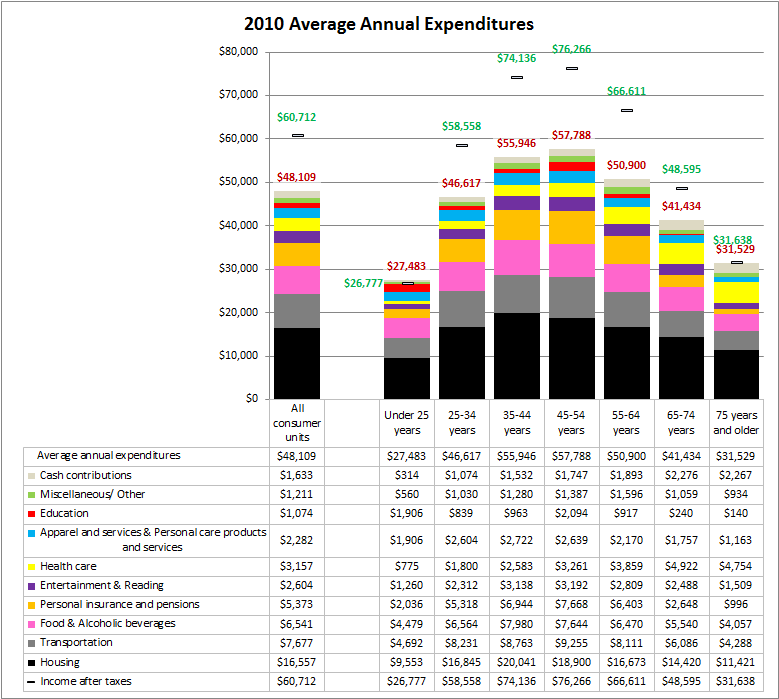
Each year the U.S. Buearu of Labor Statisits (BLS) releases a Consumer Expenditure Survey, the source of this data, to provide information on consumers’ expenditures and incomes, as well as the characteristics of those consumers. One of the ways the BLS segments groups is by age, which provides a more detailed look at expenditures.
Observations from the age based data (chart two of three):
- The only age group that, on average, spends more than their total income is those under the age of 25.
- Healthcare accounts for 11.9% of total expenditures for those age 65 to 74 and 10.1% of total income. These percentages rise for those over the age of 75 when healthcare expenses account for 15.1% of total expenditures and 15.0% of total income.
- Those age 35 to 44 spend the most on entertainment/reading ($2,312).
- People age 35 to 44 spend the most on housing ($20,041), but as a percentage of post-tax income the amount spent on housing is 27%, fifth out of the seven age groups. The highest is the under age of 25 segment at 35.7%, the lowest 24.8% for ages 55 to 64.
- Just over 7% of total income for those over the age of 75 goes to cash contributions. These expenditures include cash contributed to persons or organizations outside the consumer unit, including alimony and child support payments; care of students away from home; and contributions to religious, educational, charitable, or political organizations. The percentage is just over 1% of income for those under the age of 25.
- Approximately 10% of all post-tax income for those age 45 to 54 goes to personal insurance and pensions.
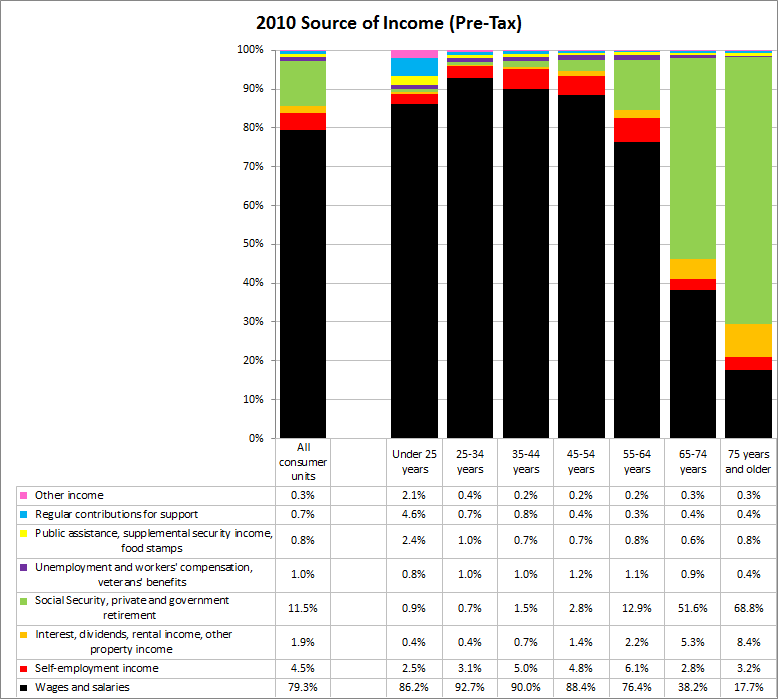
Where income comes from varies greatly by age. While the average income from wages, salaries and self-employment for a 25-34 year old individual or family was 95.9%, just over half of income for people between the ages of 65 and 74 comes from Social Security, private and government retirement.


