The fifty years spanning from 1960 to 2010 covers a lot of economic ground. In 1960 many economies around the world were still in the process of recovering from the devastating effects of World War II and the Cold War between the Soviet Union and the United States was the largest geopolitical issue of the day. A decade and a half later a global oil shock ensued, accompanied by high levels of inflation. By 1991, the Soviet Union had collapsed along with many other communist states and the world economy took off as globalization was in full swing. By the end of the first decade of the 21st century a global economic crisis led to the first year over year contraction of global economic activity since World War II.
Over this fifty year period, the United States was the largest economy, typically by a wide margin. Relative to the U.S. though, nations grew at a different rates with some gaining on the U.S. for periods of time.
One way to gauge the economies of the world relative to the U.S. is to use gross domestic product (GDP). GDP measures the size of a nations economy by totaling all final goods and services produced within a country’s borders.
Further dividing GDP by the total population of a nation is useful for understanding the economic output of a country per citizen. This is called GDP per capita. While GDP per capita does not reflect the differences in the cost of living or a standard of living, increases in GDP per capita can indicate increased productivity within a country and the economic progress of a nation.
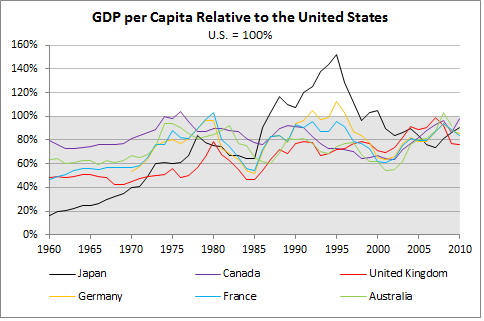
In 1960, merely 15 years after the end of World War II, GDP per capita in the U.K., France and Japan was far less then it is today.
The most remarkable improvement over the fifty year time period, below, was in Japan. In 1960 GDP per capita in Japan was only 17% of the U.S. By 1972 it was 50%, 1987 equal and then peaked in 1995 at 147%. Today the figure stands at 91%.
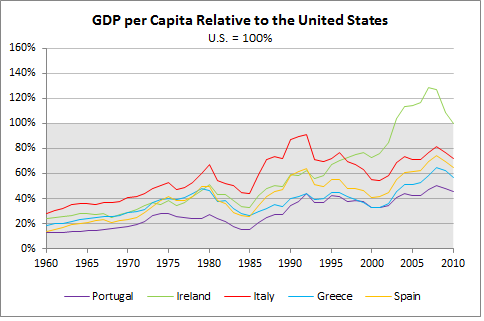
GDP per capita, relative to the U.S., for the troubled nations of Europe (Portugal, Ireland, Italy, Greece and Spain) declined during the global recession of 2009. Increadibly each of these nations had a GDP per capita that was only a fraction of the U.S.’s in 1960. Relative gains were made throughout the second half of the 20th century with great improvements coming during the 1985-1995 period and immediately after the formation of the European Monetary Union in 1999. The GDP per capita in Ireland, relative to the U.S., reached a surreal figure of 128% in 2007, right before the world plunged into a recession.
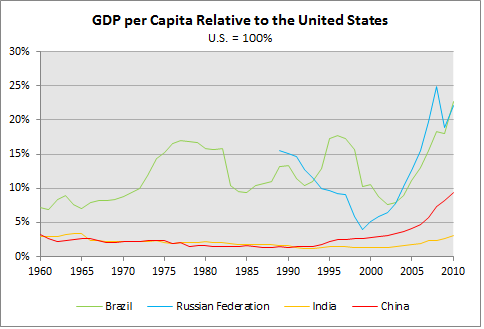
In 2001, Jim O’Neil, of Goldman Sachs, created the acronym BRIC to easily identify a sub-set of emerging economies; Brazil, Russia, India and China. GDP per capita in India and China, relative to the U.S., never climbed above 3% throughout the final forty years of the last century. While India’s relative GDP per capita stands at 3% today, China’s relative GDP per capita has more than doubled to 8% in 2010. While GDP per capita in both nations is low compared to the U.S., it should be noted that the populations of India and China are 4.3 and 3.8 times larger, respectively, then the United States.
Data Source: World Bank GDP per capita is gross domestic product divided by midyear population. GDP is the sum of gross value added by all resident producers in the economy plus any product taxes and minus any subsidies not included in the value of the products. It is calculated without making deductions for depreciation of fabricated assets or for depletion and degradation of natural resources. Data are in current U.S. dollars.

