Updated September 9, 2013: The original post under accounted for the number of employed 16-24 year old and 55 and older individuals actively working. The post has been modified to account for this fact, but the message and the underlying trend remains the same.
Last month the U.S. unemployment rate fell to 7.3%. While still elevated by historical standards it was the lowest rate since December 2008.
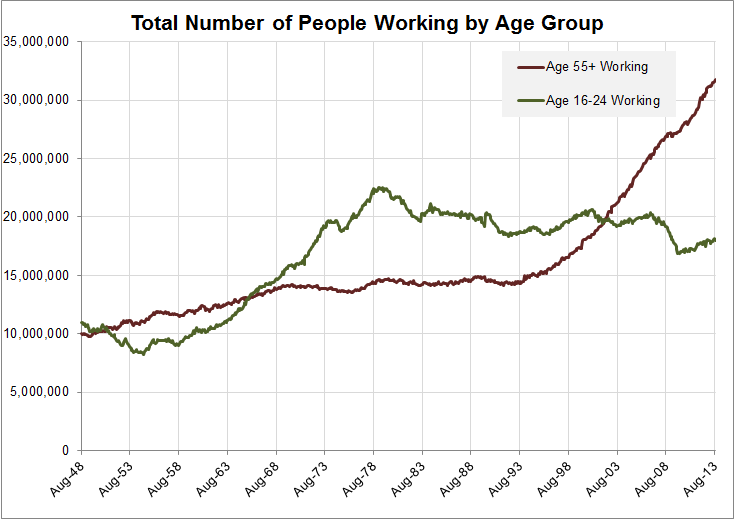
One interesting piece of data buried within the monthly employment situation report is the fact that, since April 2002, there have been more employed people that are age 55 and older than there are employed individuals between the ages of 16 and 24 and this gap continues to widen.
Last month there were 13,828,000 MORE people age 55+ working than there were working individuals between the ages of 16 and 24.
The total number of people over the age of 55 working was consistently between 10 and 15 million from 1948 to 1995. From that point on the figure started an steep ascent that has yet to show signs of letting up. The year 2001, the last year there were more 16-24 year olds working than 55 and older employed individuals, was also the year that the first individuals of the baby boom turned 55. The last of the baby boom generation will turn 55 in 2019.
On the other side, the number of people employed between the ages of 16 and 24 peaked in 1978. The largest break in the otherwise descending trend was from 1995 to 2000, perhaps coincidentally, was when many of the children from the baby boom generation (sometimes called the echo boom) were between the ages of 16 and 24.
Data Source: U.S. Bureau of Labor Statistics