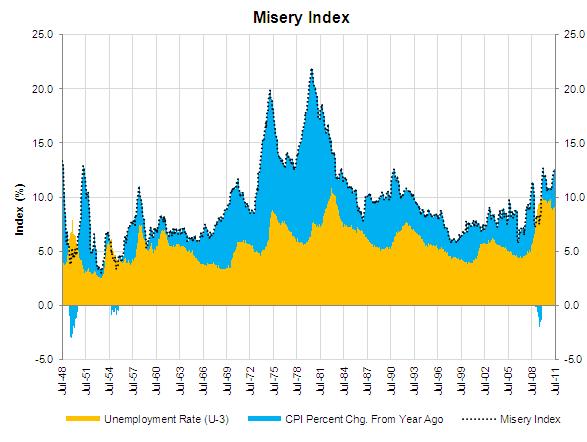
The misery index is one simple metric used to measure how economic conditions impact individuals. To calculate the index the unemployment rate is added to the rate of consumer inflation. In the chart below the U-3 official unemployment rate is added to the year over year change in the consumer price index. The idea is that individuals suffer the most when the unemployment rate is high and/or inflation is extraordinarily high.
Today the misery index stands at 12.7% as the unemployment rate for July was 9.1% and consumer prices increased by 3.6% from July 2010 to July 2011. The last time the index was this high was March 1984. What is remarkable, however, is the difference in the make up of the misery index today compared to the last time it was this elevated. Today, the unemployment rate accounts for 72% of the index and consumer inflation 28%. Compare this to the late 1970s and early 1980s when inflation dominated the misery index and regularly contributed in excess of 60% of the total.
Through the lens of the misery index, it is no great surprise that job creation has dominated the headlines over the past two years.
Source: U.S. Bureau of Labor Statistics and U.S. Bureau of Economic Activity
