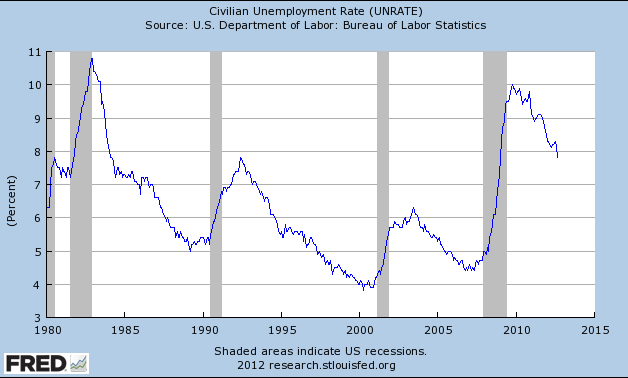
The Employment Situation report released last Friday by the U.S. Bureau of Labor Statistics reported that the unemployment rate in America fell from 8.1% in August 2012 to 7.8% in September 2012. This most recent reading was the lowest that the unemployment rate has been since January 2009, during the depths of the Great Recession. As evidenced by the first chart below, although the rate continues to fall, 7.8% is still high by recent historical standards.
What the official unemployment rate does not capture, however, is people who stop looking for work and leave the work force. These individuals are not included as “unemployed”.
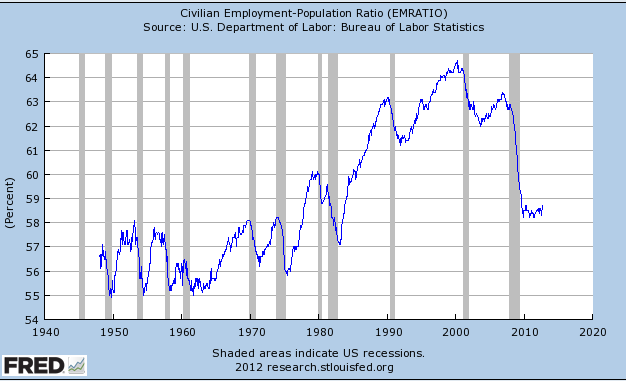
Another way to consider the employment situation in the United States is to look at the employment to population ratio because everyone is included in the “population” portion of the ratio, no matter if they are looking for work or not. This data illustrates that the percentage of Americans working as a total of the population fell dramatically during the last recession and has essentially plateaued at early 1980s levels.
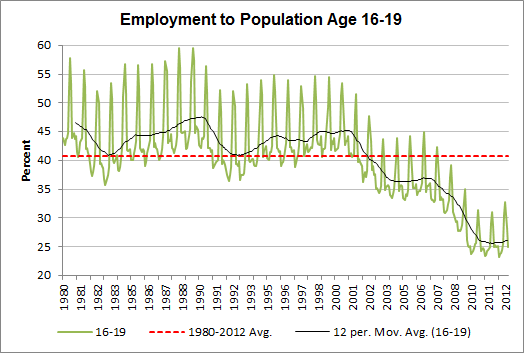
If the employment to population ratio has fallen to early 1980s levels, segmenting people by age cohorts gives further detail on where this dramatic plunge has been driven from.
Today only about 26% of late teens work. This is far below the 1980-2012 average of nearly 41%. The downward trends has persisted since 2000, far before the last recession.
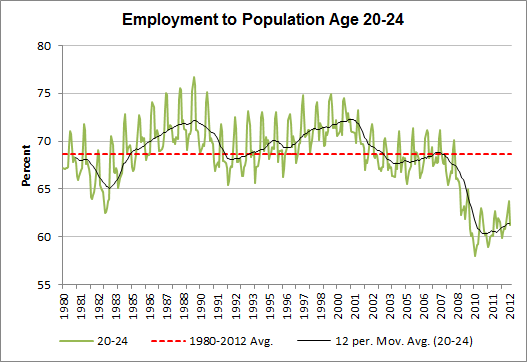
The number of individuals age 20-24 that work as a percentage of the total 20-24 year old population has rebounded since 2009 and the 12 month moving average is improving, but remains well below the 1980-2012 average.
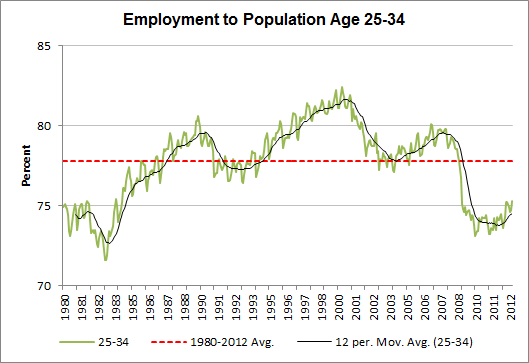
While the the average percent of people between 25 and 34 working has typically been about 78%, today only 75% are currently employed.
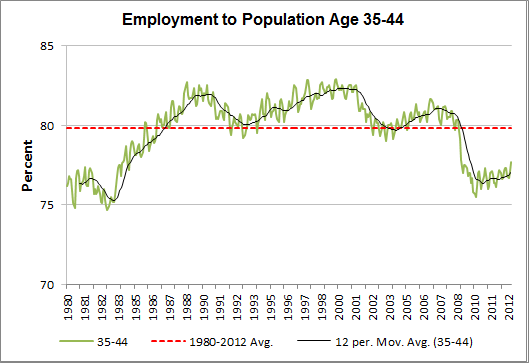
The 35-44 age cohort is has always had the highest work participation of the age groups presented. Though the long term average is nearly 80%, today the ratio is a few percentage points below the average. This employment to population ratio hit a recent low of 75.5% during February 2010. Shortly after this the one year moving average began steadily improving.
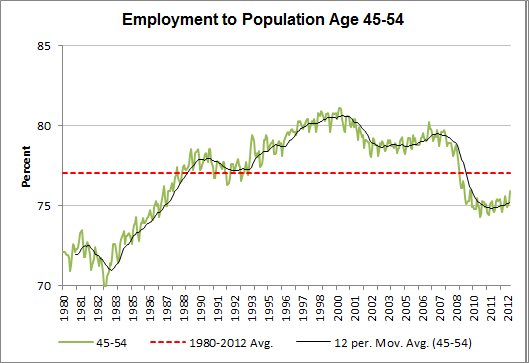
The percentage of people working between the ages of 45 and 54 was only 70% in the early 1980s, but jumped over ten percentage points by the late 1990s. The participation ratio for this group now lies between that valley and peak.
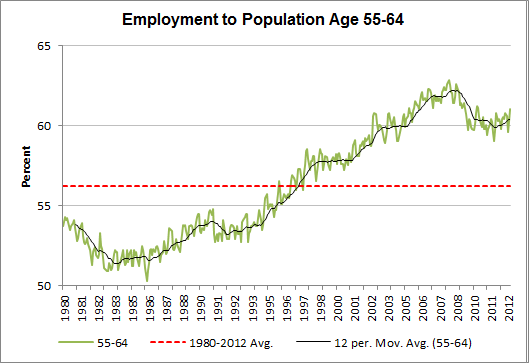
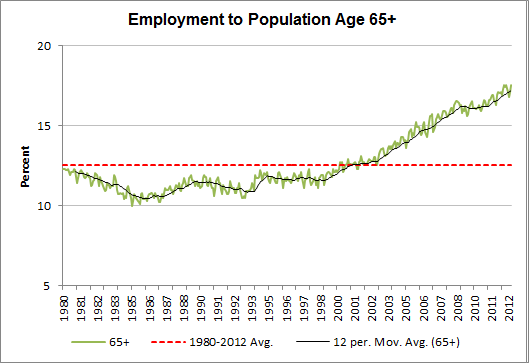
Where the labor participation ratio becomes very interesting is for people age 55-64 and over 65 years of age. Though the 55-64 year old employment to population ratio fell during the Great Recession, it is still well above the 1980-2012 average. The ratio of employment for people that fall in this age group has been mostly rising since the early 1990s.
A similar story can be told with those age 65 and over. The trend of increasing employment participation, however, did not begin until the early 2000s. This occurred approximately ten years after the rising trend of people working between the ages of 55 and 64 began during the early 1990s . Looking back at the 45-54 cohort (two charts previous to this one) the employment to population trend starts to break out in a positive direction during the early 1980s (two decades before the 65+ increasing trend).
The rising trend in people working at age 65+ can be traced back through the decades to show that people born just prior to, and during, the baby boom have always set new records for labor force participation whether it was from 1982-1992 as 45-54 year olds, 1993-2003 as 55-64 year olds or since 2003 as over the age of 65. This changing employment picture could have an impact on the U.S. economy if the trend of people working over the age of 65 continues to grow.
