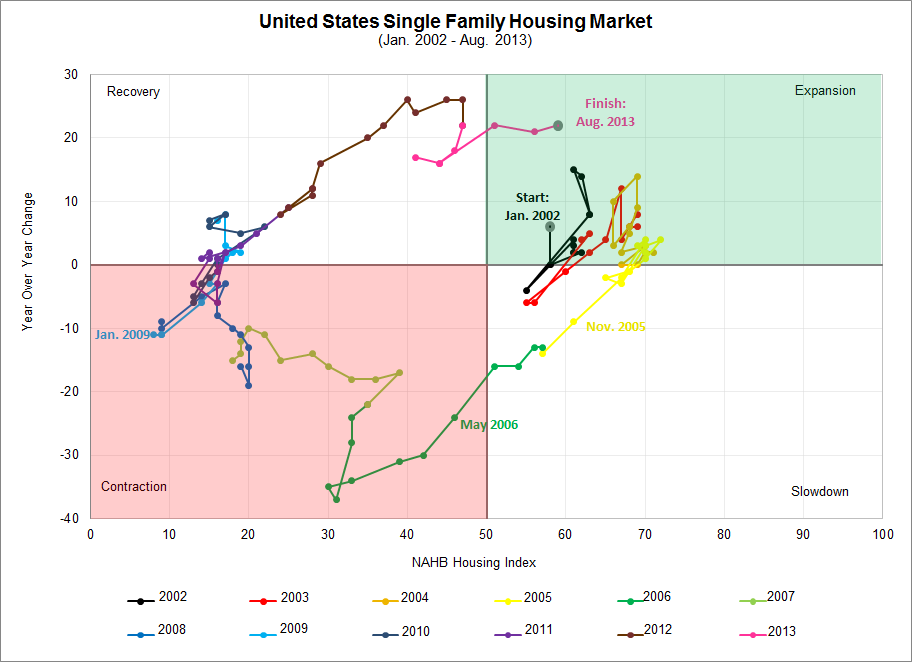
For the last three months single family housing in America has been in expansion territory. Prior to this summer, the last time the reading was expansionary was October 2005.
The chart below illustrates the four phases that the single family housing market can go through; expansion, slowdown, contraction and recovery.
The first piece of data (horizontal axis) used to calculate these regions is the monthly National Association of Home Builders (NAHB) survey which asking respondents to rate the condition of the single family housing market. According to the NAHB, “The survey asks respondents to rate market conditions for the sale of new homes at the present time and in the next 6 months as well as the traffic of prospective buyers of new homes.” A monthly result of greater than 50 signifies that more builders see the single family housing market in their area as good rather than bad, with the opposite being true if the monthly figure is less than 50.
The second item (vertical axis) used is the year over year change in the index. This helps to judge the momentum of the NAHB index.
Starting with the black line on the chart (2002) it is possible to trace the housing boom through 2005. After spending nearly five years in the expansion and slowdown quadrants, by May 2006 the single family housing market had entered a contractionary phase.
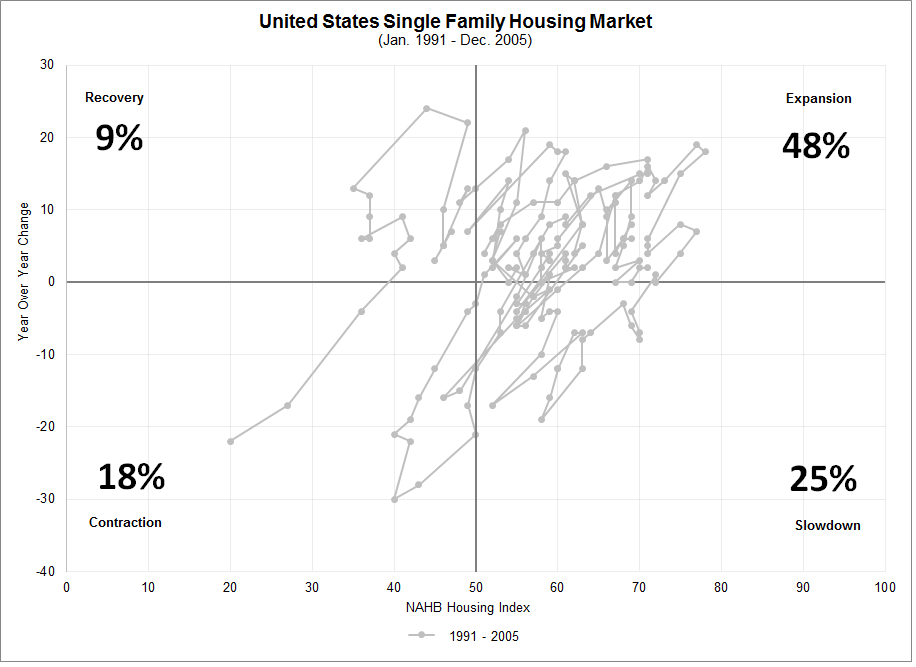
Howdoes this round trip from expansion in 2002 to expansion in 2013 compare to previous years?
Remarkably, prior to 2006 sentiment for the single family housing market was positive 73% of the time. It was in expansionary territory nearly half of the time and in slowdown mode (weakening, but still positive sentiment) 25% of the time. Only 18% of the time was the market in contraction.
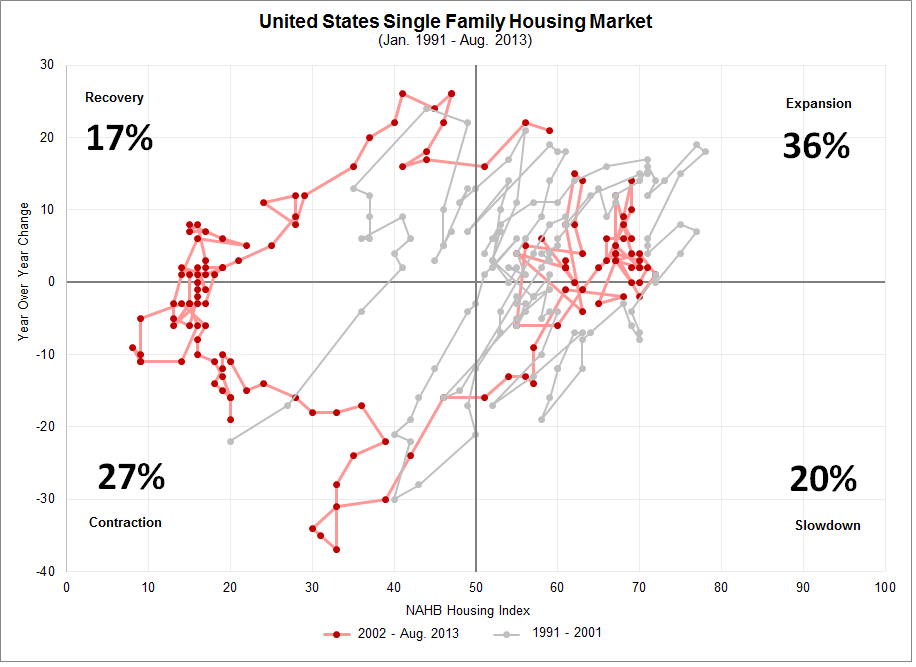
The housing boom, bust and current conditions evened out the amount of time the market spent in each phase. Instead of 48% expansion, from 1991 to August 2013, the single family housing market has only been in expansionary territory 36% of the time. The amount of time spend in contraction increased from 18% to 27%.
Data Source: National Association of Home Builders