During the month of February the annualized rate of new private housing building permits increased to 946,000 from January’s 904,000, according the U.S. Census Bureau. Last months reading was the highest annual rate since since June 2008 and well above the 2009 lows. Building permits do not necessarily lead to new houses being built, but can be an indicator of potential new construction.
The U.S. Census Bureau breaks down new building permits into three categories; 1 unit structures, 2-4 unit structures and 5 or more unit structures. In the last release, fully a third of all new building permits came from the 5 or more unit structure category. This has been the case for the majority of the months over the past year.
Apart from the last year, the percentage of new building permits that are for structures of 5 or more units abnormally high, given recent history. In fact, apart from the last year, in only four months over the past 27 years have these 5 or more unit structures represented greater than a third of all new building permits.
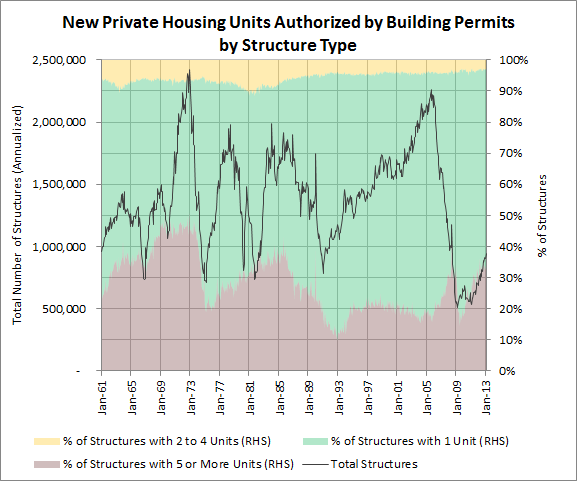
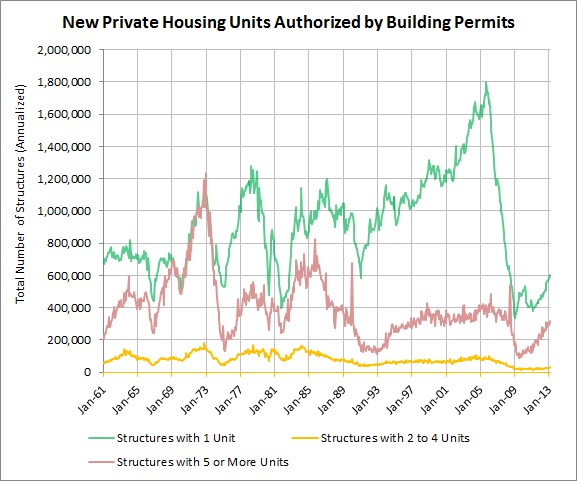
The annualized number of new housing permits for 5 or more unit structures is closing in on the levels reached during the late 1990s and 2000s.
While the number of new housing permits for single unit structures has been trending upward since 2009, it remains well below the levels of the late 1990s and 2000s.
Data Source: U.S. Census Bureau