2012 U.S. Federal Budget and a History of Federal Government Outlays Since 1940
President Obama recently submitted his proposal for the budget of the United States government for the 2012 fiscal year. The New York Times has created an interactive graphic that breaks apart the $3.7 trillion in spending proposals and illustrates which areas the president is proposing the government cut spending and which areas will increase. The New York Times info-graphic includes both mandatory and discretionary spending.
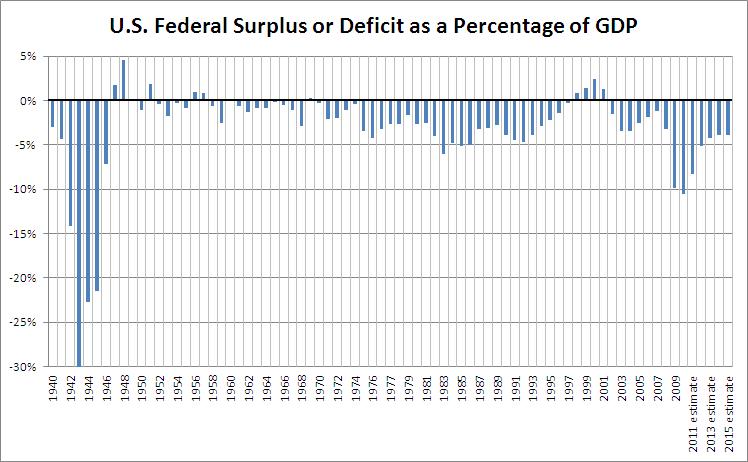
The last time the budget resulted in a surplus was in 2001.
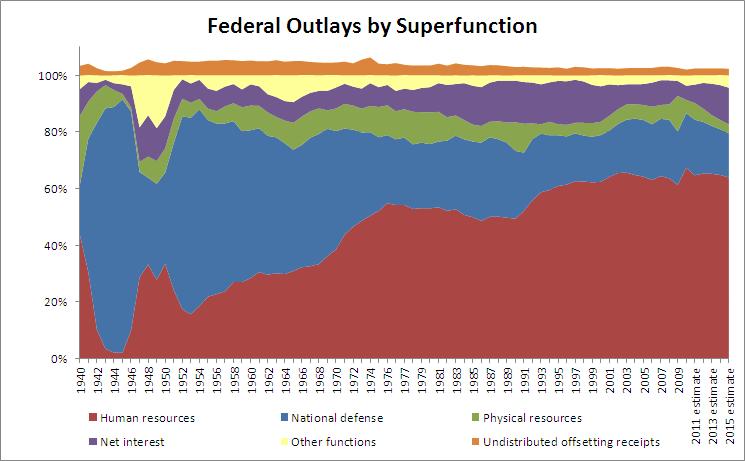
Federal government spending as a percentage of total spending broken apart by superfunction (since 1940)
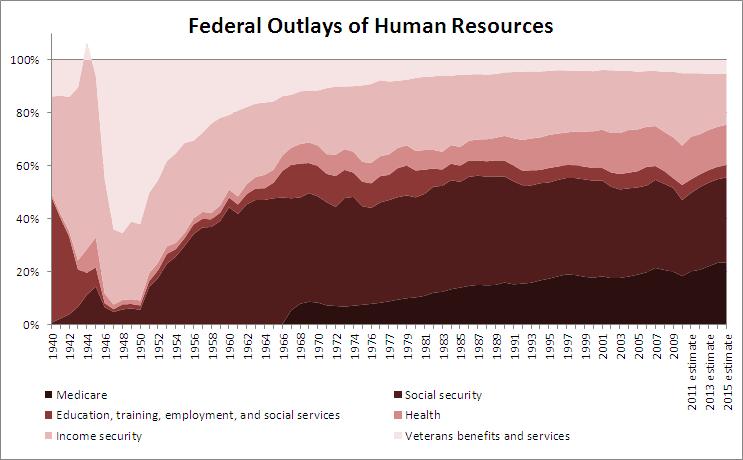
Human resources spending component of federal government spending as a percentage of total human resources spending (since 1940)
- Human Resources
- Education, training, employment, and social services
- Health
- Medicare
- Income security
- Social Security
- Veterans benefits and services
- Physical Resources
- Energy
- Natural resources and environment
- Commerce and housing credit
- Transportation
- Community and regional development
- Other Functions
- International affairs
- General science, space and technology
- Agriculture
- Administration of justice
- General government
- Allowances
- National Defense
- Net Interest
- Undistributed offsetting receipts


